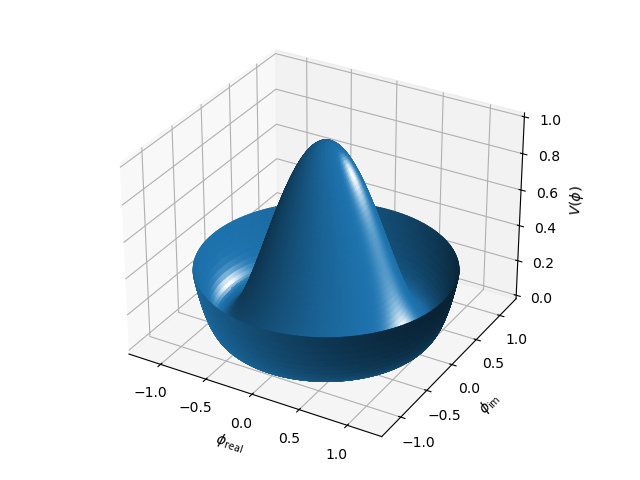
3D Surface in Polar Coordinates
This is a comparison to the 3D surface with polar coordinates Matplotlib example.
import numpy as np
import matplotlib.pyplot as plt
import s3dlib.surface as s3d

#.. Matplotlib Examples: 3D surface in polar coordinates

# 1. Define function to examine ....................................

def polarfunc(rtz) :
    r,t,z = rtz
    Z = ((r**2 - 1)**2)
    return r,t,Z

# 2. Setup and map surface .........................................

surface = s3d.PolarSurface(6, cmap='YlGnBu_r').domain(1.25) # extend the evaluation domain
surface.map_geom_from_op( polarfunc).shade()
#surface.map_cmap_from_op().shade(.5)

# 3. Construct figure, add surface, and plot ......................

fig = plt.figure()
ax = plt.axes(projection='3d')
minmax = (-1.3,1.3)
ax.set(xlim=minmax, ylim=minmax, zlim=(0,1))

ax.set_xlabel(r'$\phi_\mathrm{real}$')
ax.set_ylabel(r'$\phi_\mathrm{im}$')
ax.set_zlabel(r'$V(\phi)$')

ax.add_collection3d(surface)
#ax.add_collection3d(surface.hilite(focus=3))
fig.tight_layout()
plt.show()
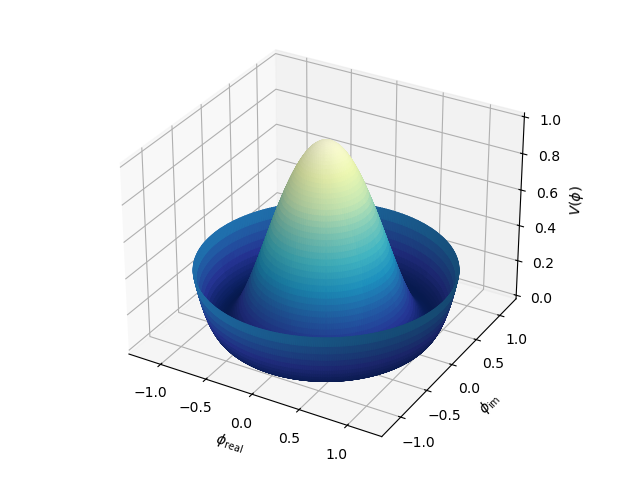
The surface will be colormapped when un-commenting the high-lighted line following the geometric mapping. Since a PolarSurface object is used, the default colormapping direction is in the z-direction. Instead of using the default, a lambda expression can be used to define the direction as:
surface.map_cmap_from_op( lambda rtz : rtz[2] )
Alternatively, a function could be defined explicitly as:
def cmap_Z_dir(rtz) :
    r,t,z = rtz
return z
then the mapping direction would be expressed using this function for mapping as:
surface.map_cmap_from_op( cmap_Z_dir )
When the cmap coloration is used, the following plot results:
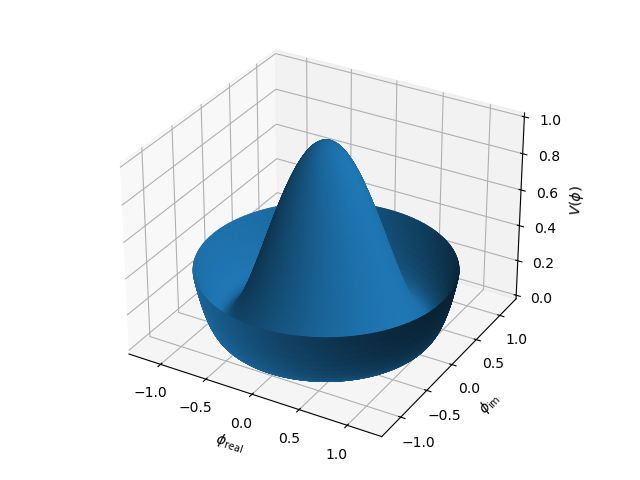
The surface curvature can be visually accentuated using the hilite method as shown in the following image.