
Goursat Cloud Surface
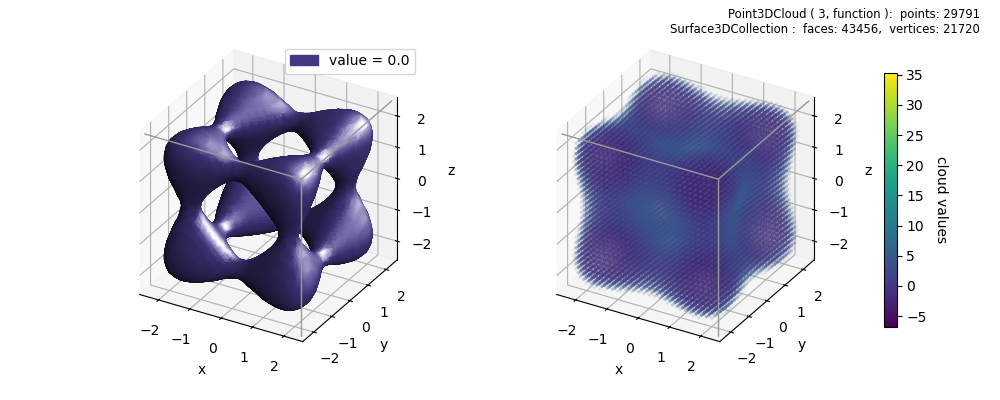
Clouds within a domain are genereated from 3-D functions, f(x,y,z). Surfaces within the cloud domain can then be determined for at a constant value. This example used the function in the Goursat Surface example, evaluated for a cloud value of zero within the domain. A value of zero is the default for the implsurf surface method.
import numpy as np
import matplotlib.pyplot as plt
from matplotlib import cm,colors,colormaps,patches
import s3dlib.surface as s3d
import s3dlib.pntcloud as ptc

# 1. Define function to examine .....................................

def goursat_tangle(xyz):
    x,y,z = xyz
    a,b,c = 0.0,-5.0,11.8
    return x**4+y**4+z**4+a*(x**2+y**2+z**2)**2+b*(x**2+y**2+z**2)+c

# 2. Setup and map surface .........................................
drez, domain, fval = 3, 2.5, 0.0

cloudObj = ptc.Point3DCloud(drez,domain=domain)
cloudObj.map_vals_from_op(goursat_tangle)
cloudObj.map_cmap_from_cloudvals()
surface = cloudObj.valsurf(fval)
surface.triangulate(1)

c,v,n =  cloudObj.get_color_for_val( [fval] )
xlim,ylim,zlim = cloudObj.get_domain()

# 3. Construct figures, add surfaces, and plot ....................
fig = plt.figure(figsize=(10,4))
fig.text(.98,.98,str(cloudObj)+'\n'+str(surface),ha='right',va='top', fontsize='smaller')
# ....................
ax = fig.add_subplot(121, projection='3d', aspect='equal',proj_type='ortho')
ax.set(xlim=xlim, ylim=ylim, zlim=zlim, xlabel='x',ylabel='y',zlabel='z')
ax.add_collection3d(surface.shade(flat=False).hilite(flat=False))
s3d.add_boxCorner(ax,domain)
ax.legend(handles=[patches.Patch(label='value = '+str(fval), color=c[0] )])
# ....................
ax = fig.add_subplot(122, projection='3d', aspect='equal',proj_type='ortho')
ax.set(xlim=xlim, ylim=ylim, zlim=zlim, xlabel='x',ylabel='y',zlabel='z')
cloudObj.add_to3d(ax,*n,span=.20)
s3d.add_boxCorner(ax,domain)
scmp = cloudObj.cBar_ScalarMappable
cbar = plt.colorbar(scmp, ax=ax,  shrink=0.8, pad=.1 )
cbar.set_label('cloud values', rotation=270, labelpad = 15)
# ....................
fig.tight_layout(pad=3)
plt.show()