
Surface color from a Cloud, III
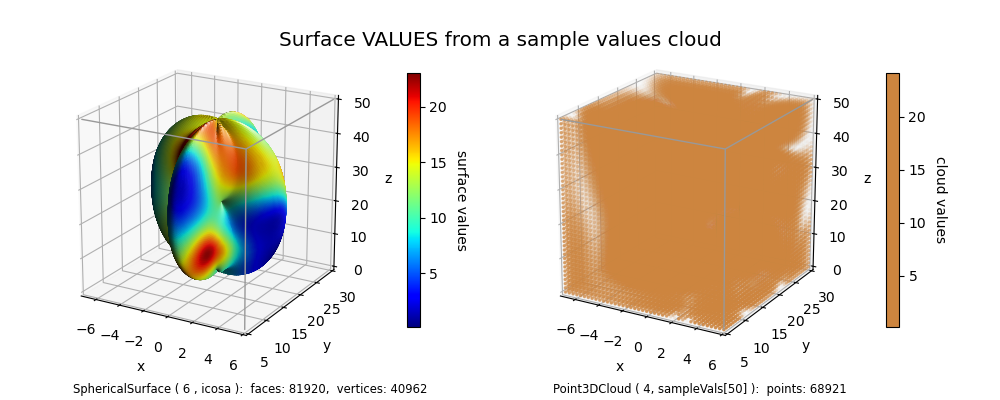
Note, in this case the point cloud has values assigned however no colormapping is preformed. Since the cloud is not mapped, the surface colorbar is normalized to the min/max of the surface values and uses the entire assigned cmap.
A comparison of coloring methods is given in the Comparison of Surface Color Methods from clouds example.
import numpy as np
import matplotlib.pyplot as plt
import s3dlib.surface as s3d
import s3dlib.pntcloud as ptc

# 0. generate data samples with values ............................
N,seed,val_mult,domain = 50, 6, 25.0, [ [-7,6], [5,30], [0,50] ]
np.random.seed(seed)
xc = np.random.uniform(*domain[0], N)
yc = np.random.uniform(*domain[1], N)
zc = np.random.uniform(*domain[2], N)
dt_coor = np.column_stack((xc,yc,zc))
vals = val_mult*np.random.uniform(size=N)
vmin,vmax,vmid = np.min(vals),np.max(vals), ( np.min(vals) + np.max(vals) )/2
points = np.column_stack((dt_coor,vals))

# 1. Define function to examine .....................................

def deflate(rtp) :    #... for the surface geometry
    r,t,p = rtp
    scale = 0.4
    Rz = np.cos(p)
    Rxys = (1-scale)*np.sin(p) + scale*np.cos(4*t)
    R = r*np.sqrt( Rz**2 + Rxys**2)
    return .9*R,t,p

# 2. Setup and map surface .........................................
rez,drez,vadj,cmap = 6,4, 'c', 'jet'

cloudObj = ptc.Point3DCloud(drez,color='peru',domain=domain)
cloudObj.map_vals_from_sampvals(points,vadj=vadj)

surface = s3d.SphericalSurface(rez)
surface.map_geom_from_op(deflate).transform(translate=[0,18,25],scale=[6,13,23])
surface.map_vertvals_from_cloud(cloudObj)
surface.map_cmap_from_vertvals(cmap)

# 3. Construct figures, add surfaces, and plot ....................
xlim,ylim,zlim = cloudObj.get_domain()
fig = plt.figure(figsize=(10,4))
title = 'Surface VALUES from a sample values cloud'
fig.text(.50,.90,title,ha='center',va='center',fontsize='x-large')
fig.text(.25,.01,str(surface), ha='center',va='bottom',fontsize='small')
fig.text(.70,.01,str(cloudObj),ha='center',va='bottom',fontsize='small')
# ....................
ax = fig.add_subplot(121, projection='3d', aspect='equal')
ax.set(xlim=xlim, ylim=ylim, zlim=zlim, xlabel='x',ylabel='y',zlabel='z')
ax.view_init(20)
ax.add_collection3d(surface.shade(flat=False).hilite(flat=False))
s3d.add_boxCorner(ax,domain)
scmp = surface.cBar_ScalarMappable
cbar = plt.colorbar(scmp, ax=ax,  shrink=0.8, pad=.1 )
cbar.set_label('surface values', rotation=270, labelpad = 15)
# ....................
ax = fig.add_subplot(122, projection='3d', aspect='equal')
ax.set(xlim=xlim, ylim=ylim, zlim=zlim, xlabel='x',ylabel='y',zlabel='z')
ax.view_init(20)
cloudObj.add_to3d(ax,0,.5,1,span=.25)
s3d.add_boxCorner(ax,domain)
scmp = cloudObj.cBar_ScalarMappable
cbar = plt.colorbar(scmp, ax=ax,  shrink=0.8, pad=.1 )
cbar.set_label('cloud values', rotation=270, labelpad = 15)
# ....................
fig.tight_layout(pad=3)
plt.show()