import numpy as np
from matplotlib import pyplot as plt
import matplotlib.colors as colors
import s3dlib.surface as s3d
import s3dlib.cmap_utilities as cmu
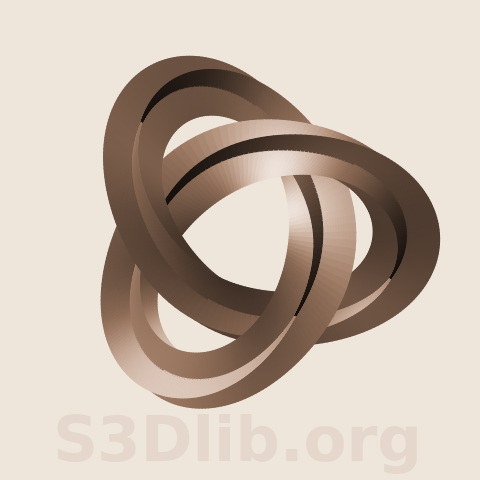
#.. #2 - influenced by M.C.Escher - Knots
# https://mcescher.com/gallery/mathematical/
# 1. Define functions to examine ....................................
wdth = 0.9
elev, azim = 90, -60
illum = [1,-1,1]
def flatten(rtz) :
r,t,z = rtz
R = 1-z*wdth/2
return R,t,np.zeros(len(z))
def twistFunction(rtz) :
r,t,z = rtz
twists, toff = 1.0 , 0.25
offset = toff*np.pi
x0 = 1-r
y0 = z
r0, t0, temp = s3d.PolarSurface.coor_convert([x0,y0,np.zeros(len(z))])
t0 = t0 - t*twists + offset
x1, y1, temp = s3d.PolarSurface.coor_convert([r0,t0,np.zeros(len(z))],True)
R = 1 - x1
Z = y1
return R,t,Z
def Trefoil(rtz) :
r,t,z = twistFunction(rtz)
rw = 1-wdth/2
X = rw*(np.sin(t)+2*np.sin(2*t))
Y = rw*(np.cos(t)-2*np.cos(2*t))
R0,T,Z = s3d.PolarSurface.coor_convert([X,Y,z])
R = R0 + r - rw
Z = z - np.sin(3*t)
return R,T,Z
# 2. Setup and map surfaces .........................................
a,b, color = 24, 400, [ 0.659, 0.502, 0.400 ]
surface1 = s3d.CylindricalSurface.grid(a,b,'r',color=color)
surface1.map_geom_from_op(flatten)
surface1.map_geom_from_op( Trefoil )
surface2 = s3d.CylindricalSurface.grid(a,b,'r',color=color)
surface2.transform(scale=[1,1,wdth/2])
surface2.map_geom_from_op( Trefoil )
cross = surface1+surface2
# 3. Construct figure, add surfaces, and plot ......................
fig = plt.figure(figsize=plt.figaspect(1))
info, infocolor = 'S3Dlib.org', [0.898,0.843,0.800]
text = fig.text(0.11, 0.04, info, color=infocolor, fontsize=45, fontweight='bold' )
ax = plt.axes(projection='3d', aspect='equal')
minmax = (-1.8,1.8)
ax.set(xlim=minmax, ylim=minmax, zlim=minmax )
ax.set_axis_off()
ax.set_proj_type('ortho')
ax.set_facecolor( [ 0.933, 0.902, 0.859 ] )
ax.view_init(elev,azim)
cross.shade( direction=illum, ax=ax, rview=True)
cross.hilite(.8,direction=illum, ax=ax, rview=True)
ax.add_collection3d(cross)
fig.tight_layout(pad=0)
plt.show()