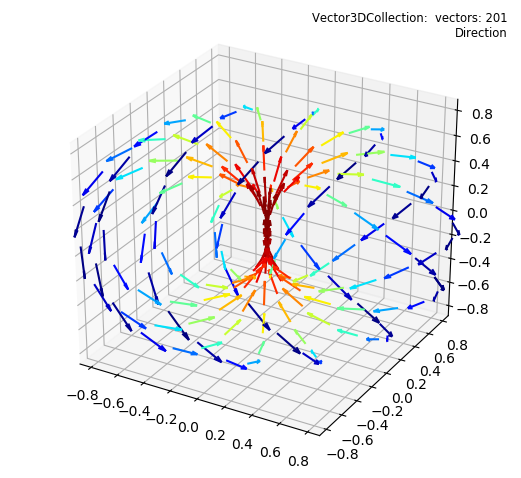
import numpy as np
from matplotlib import pyplot as plt
import s3dlib.surface as s3d
import s3dlib.cmap_utilities as cmu

# 1. Define function to examine ....................................
Rm,Rl,nL,tilt = 0.6,0.6,12,0.1

def loop(t, isDer=False) :
    theta = 2*np.pi*t + np.pi/2
    phi = 2*np.pi*nL*t
    psi = tilt*np.pi*np.sin(phi)

    r = Rm + Rl*np.cos(phi)
    eta = theta + psi

    x = r*np.sin( theta + psi )
    y = r*np.cos( theta + psi )
    z = Rl*np.sin(phi)

    if isDer :
        drdt = -2*np.pi*Rl*nL*np.sin(phi)
        detadt = 2*np.pi*(1.0+tilt*nL*np.pi*np.cos(phi))
        u = drdt*np.sin(eta) + y*detadt
        v = drdt*np.cos(eta) - x*detadt
        w = Rl*2*np.pi*nL*np.cos(phi)
        return u,v,w
    return x,y,z

lineVals = np.linspace(0.0,1.0, 200+1)
xyz = np.array( loop(lineVals) ).T
uvw = -0.004*np.array( loop(lineVals,True) ).T

# 2. Setup and map vectors ........................................

vf = s3d.Vector3DCollection(xyz,uvw, color='k')
vf.map_cmap_from_direction('jet',[0,0,1])

# 3. Construct figure, add surface, and plot ......................

fig = plt.figure(figsize=plt.figaspect(0.92))
fig.text(0.975,0.975,str(vf)+'\n'+vf.cname,
    ha='right', va='top', fontsize='smaller', multialignment='right')
ax = plt.axes(projection='3d')
minmax = (-0.85,0.85)
ax.set(xlim=minmax, ylim=minmax, zlim=minmax )

ax.add_collection3d(vf)

fig.tight_layout()
plt.show()

