
Vector Field Demo 2
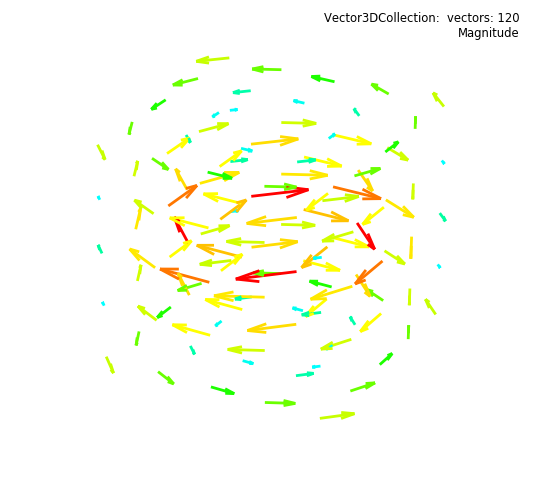
The functional description is found at Mayavi quiver3d example. In this case, the vectors were color mapped based on the vector magnitude using a custom colormap

import numpy as np
from matplotlib import pyplot as plt
import s3dlib.surface as s3d
import s3dlib.cmap_utilities as cmu

# 1. Define function to examine ....................................

# +----------------------------------------------------------------------------
# |  The following code between the ========= comments was copied DIRECTLY from
# |  https://docs.enthought.com/mayavi/mayavi/auto/mlab_helper_functions.html#mayavi.mlab.quiver3d
# +----------------------------------------------------------------------------
# ===================================================== start of copy.
x, y, z = np.mgrid[-2:3, -2:3, -2:3]
r = np.sqrt(x ** 2 + y ** 2 + z ** 4)
u = y * np.sin(r) / (r + 0.001)
v = -x * np.sin(r) / (r + 0.001)
w = np.zeros_like(z)
# ===================================================== end of copy.

xyz = np.reshape(np.array( [x,y,z] ).T,(-1,3))
uvw = np.reshape(np.array( [u,v,w] ).T,(-1,3))

# 2. Setup and map vectors ........................................
cyrd = cmu.hue_cmap('c','r',2.0,name='CyanRed')

vf = s3d.Vector3DCollection(xyz,uvw,alr=0.4,lw=2)
vf.map_cmap_from_magnitude(cyrd)

# 3. Construct figure, add surface, and plot ......................

fig = plt.figure(figsize=plt.figaspect(.9))
fig.text(0.975,0.975,str(vf)+'\n'+vf.cname,
    ha='right', va='top', fontsize='smaller', multialignment='right')
ax = plt.axes(projection='3d')
s3d.auto_scale(ax,vf)
ax.set_axis_off()

ax.add_collection3d(vf)

fig.tight_layout()
plt.show()