
Object Rotation
Surface objects can be transformed so that the surface rotates relative to the origin using the transform method:
surface.transform(matrix)
where the matrix argument is a 3x3 transformation matrix, e.g.
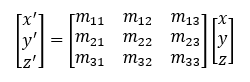
The use of a transformation matrix argument provides flexibility. In addtion, S3Dlib provides three methods for evaluating the matrix from rotation angles.
Euler angles
Calculating the rotational matrix from Euler angles is obtained by using the function:
matrix = s3d.eulerRot(theta, phi, psi=0, useXconv=True, inrad=False)
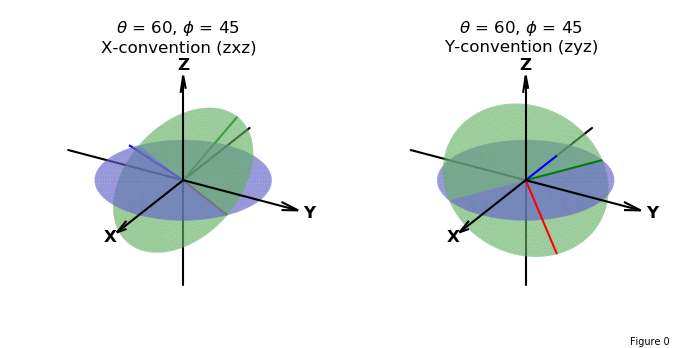
where theta, phi and psi ( θ, φ, ψ ) are Euler rotational angles about the coordinate axis using the right-hand rule. The angles are in degrees as the default. Rotations in 3D are dependent on the sequence of rotations. Two conventions are supported. The sequence of rotations are
| Order | Rotation | X-convention (zxz) | Y-convention (zyz) |
|---|---|---|---|
| 1 | θ | Z - axis | Z - axis |
| 2 | φ | X - axis | Y - axis |
| 3 | ψ | Z - axis | Z - axis |
The default is to use X-convention. Setting the useXconv argument to False changes the interpretation to Y-convention. When the inrad argument is set to True, the rotational angles will be interpreted in radians. The rotation of the coordinate axis is shown below, which illustrates the difference between the X and Y conventions.
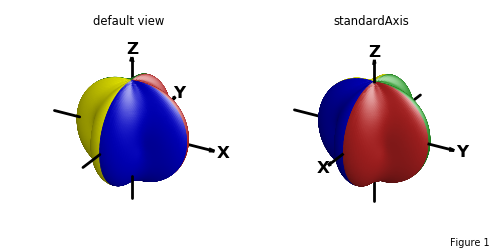
To illustrate the final rotation ψ about the z-axis (shown in blue in the above figure), consider the following surface shown in the default view and standard axis view below:
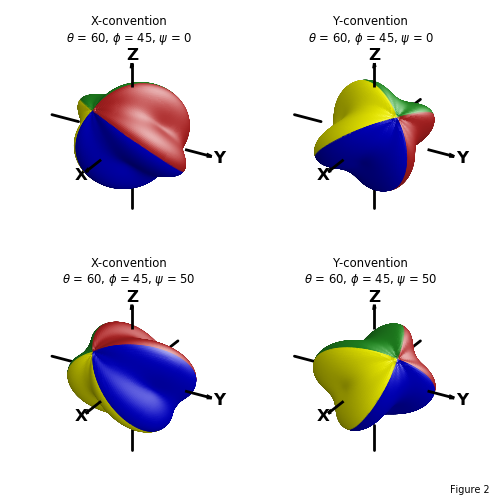
The following shows the same surface using a standard axis and various surface rotations. Plots have the same values for θ and φ which were used in the previous coordinate plot. The effect of the ψ rotation is seen by comparing the top to bottom surface orientations.
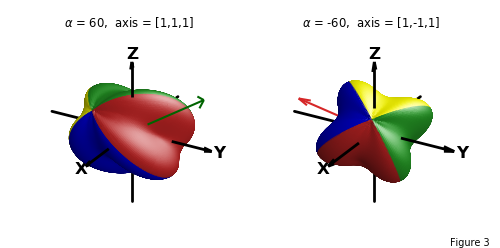
Rotation About a Direction
Calculating the rotational matrix from rotation angles about a direction is obtained by using the function:
matrix = s3d.axisRot(alpha,direction)
where the surface is rotated about a direction in the amount alpha.
Rotation From Two Vector Directions
Calculating the rotational matrix from two direction vectors is obtained by using the function:
matrix = s3d.vectRot(xDirection,in_planeDirection)
where, using the transformation matrix, the surface is rotated with the x-axis in the xDirection and the in-planeDirection lying in the x-y plane. The transform coordinate axes are conveniently obtained from the matrix by:
x_p = matrix[0]
y_p = matrix[1]
z_p = matrix[2]
The following illustration using this function shows the two argument directions, transform coordinates, the plane of rotation along with the transformed surface.
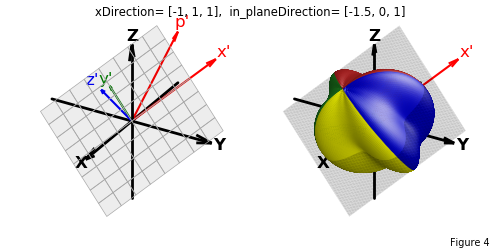
This method is useful for visualizations including surface contours and projections, as shown in the General Surface Contour Projections example.
Source Code
Source code for the rotated object figures is given below:
import copy
import numpy as np
import matplotlib.pyplot as plt
from matplotlib.colors import ListedColormap
import s3dlib.surface as s3d

#.. Guides: Orientation - Object Rotations

fourColor_cmap = ListedColormap(['firebrick','forestgreen','yellow','mediumblue'])
rez = 6
illum = [0,1,1]

# 1. Define functions to examine ....................................

def deflate(rtp) :
    r,t,p = rtp
    scale = 0.2
    Rz = np.cos(p)
    Rxys = (1-scale)*np.sin(p) + scale*np.cos(4*t)
    R = np.sqrt( Rz**2 + Rxys**2)
    return R,t,p

# Figure 0 : Euler XY-Conventions =======================================================
drez,theta,phi = 5, 60, 45
initColor, tranColor = [0.4,0.4,0.8,0.6] , [0.4,.7,0.4, 0.6]

comboSurface, title, lineColl = [None]*2, [None]*2, [None]*2
for i in range(2) :
    r = s3d.PolarSurface(drez, color=initColor)
    r.transform(rotate=s3d.eulerRot(theta,0,useXconv=i==0))
    s = s3d.PolarSurface(drez, color=tranColor)
    s.transform(rotate=s3d.eulerRot(theta,phi,useXconv=i==0))
    comboSurface[i] =  r + s
    comboSurface[i].set_linewidth(0.1)
    lineColl[i] = s.get_transformAxis(lenmult=1)
    t = r'$\theta$ = {}, $\phi$ = {} '.format(theta,phi)
    title[i] = t+'\nX-convention (zxz)' if i==0 else t+'\nY-convention (zyz)'

fig = plt.figure(figsize=(7,3.5))
fig.text(0.9,0.01,'Figure 0', fontsize='x-small')
for i in range(2) :
    ax = fig.add_subplot(121+i, projection='3d')
    ax.set_title(title[i])
    s3d.standardAxis( ax, negaxis=True, alr=.15, width=1.5)
    ax.add_collection3d(comboSurface[i])
    ax.add_collection3d(lineColl[i])
fig.tight_layout()

# Figure 1 : 2 unrotated surfaces =======================================================

surface = s3d.SphericalSurface(rez,basetype='octa')
surface.map_cmap_from_op(lambda rtp : rtp[1], fourColor_cmap)
surface.map_geom_from_op(deflate)

minmax, width = (-1,1), 5

fig = plt.figure(figsize=(width, width/2))
fig.text(0.9,0.01,'Figure 1', fontsize='x-small')

ax1 = fig.add_subplot(121, projection='3d')
ax2 = fig.add_subplot(122, projection='3d')
ax1.set(xlim=minmax, ylim=minmax, zlim=minmax)
ax2.set(xlim=minmax, ylim=minmax, zlim=minmax)
ax1.set_title('default view' +'\n', fontsize='small')
ax2.set_title('standardAxis' +'\n', fontsize='small')
surf1 = copy.copy(surface).shade(.3).hilite(.7)
surf2 = copy.copy(surface).shade(.3,illum).hilite(.7,illum)
s3d.setupAxis( ax1, offset=1.0, negaxis=True  )
ax1.set_axis_off()
s3d.standardAxis( ax2, offset=1.0, negaxis=True  )

ax1.add_collection3d(surf1)
ax2.add_collection3d(surf2)

fig.tight_layout()

# Figure 2 : 4 Euler rotations ==========================================================
theta, phi, psi_v = 60, 45, 50

cnt = [ [True,0], [False,0], [True, psi_v], [False, psi_v]  ]
fig = plt.figure(figsize=(width,width))
fig.text(0.9,0.01,'Figure 2', fontsize='x-small')

for i in range(4) :
    surf = copy.copy(surface)
    isX, psi = cnt[i]
    surf.transform(s3d.eulerRot(theta,phi,psi,useXconv=isX))
    surf.shade(.3,illum).hilite(.7,illum)
    title = 'Y-convention\n'
    if isX : title = 'X-convention\n'
    title2 = r'$\theta$ = {}, $\phi$ = {}, $\psi$ = {}'.format(theta,phi,psi)
    ax = fig.add_subplot(221+i, projection='3d')
    ax.set_title(title+title2, fontsize='small')
    s3d.standardAxis( ax, offset=1.0, negaxis=True  )

    ax.add_collection3d(surf)

fig.tight_layout()

# Figure 3 : 2 Direction rotations ======================================================
pos1, alpha1, direction1 = [0.7,0.7,0.7], 60, [2.5,2.5,2.5]
pos2, alpha2, direction2 = [0.4,-.4,0.4], -60, [.5,-.5,.5]

vf1 = s3d.Vector3DCollection(np.array([pos1]),np.array([direction1]),0.1,color='darkgreen')
vf2 = s3d.Vector3DCollection(np.array([pos2]),np.array([direction2]),color='C3')

fig = plt.figure(figsize=(width, width/2))
fig.text(0.9,0.01,'Figure 3', fontsize='x-small')
ax1 = fig.add_subplot(121, projection='3d')
ax2 = fig.add_subplot(122, projection='3d')
ax1.set(xlim=minmax, ylim=minmax, zlim=minmax)
ax2.set(xlim=minmax, ylim=minmax, zlim=minmax)
dStr1 =  r'$\alpha$ = {},  axis = {}'.format(alpha1,"[1,1,1]")
dStr2 =  r'$\alpha$ = {},  axis = {}'.format(alpha2,"[1,-1,1]")
ax1.set_title(dStr1 +'\n', fontsize='small')
ax2.set_title(dStr2 +'\n', fontsize='small')
surf1 = copy.copy(surface)
surf1.transform(s3d.axisRot(alpha1,direction1) )
surf1.shade(.3,illum).hilite(.7,illum)
surf2 = copy.copy(surface)
surf2.transform(s3d.axisRot(alpha2,direction2) )
surf2.shade(.3,illum).hilite(.7,illum)
s3d.standardAxis( ax1, offset=0.75, negaxis=True  )
s3d.standardAxis( ax2, offset=0.5, negaxis=True  )

ax1.add_collection3d(surf1)
ax2.add_collection3d(surf2)
ax1.add_collection3d(vf1)
ax2.add_collection3d(vf2)

fig.tight_layout()

# Figure 4 : Rotation from 2 Vectors ====================================================
xDir, pDir = [-1,1,1], [-1.5,0,1]
unitDirc = s3d.vectRot(xDir, pDir)

surface = s3d.SphericalSurface(rez,basetype='octa')
surface.map_cmap_from_op(lambda rtp : rtp[1], fourColor_cmap)
surface.map_geom_from_op(deflate)
surface.transform(unitDirc)
surface.shade(.3,illum).hilite(.7,illum)

origin = [0,0,0]
grid = s3d.PlanarSurface(2,'squ',color=[0,0,0,0.07],edgecolor='darkgrey',lw=0.5).domain(0.8)
grid.transform(unitDirc, scale=1.5)
gplane = s3d.PlanarSurface(rez,color='k').domain(0.8)
gplane.set_surface_alpha(0.075)
gplane.transform(unitDirc, scale=1.5)

vfx = s3d.Vector3DCollection(np.array([origin]),np.array([xDir]),0.1,color='red')
vfx2 = s3d.Vector3DCollection(np.array([origin]),np.array([xDir]),0.1,color='red')
vfp = s3d.Vector3DCollection(np.array([origin]),np.array([pDir]),0.1,color='red')
vfy = s3d.Vector3DCollection(np.array([origin]),np.array([unitDirc[1]]),0.1,color='green')
vfz = s3d.Vector3DCollection(np.array([origin]),np.array([unitDirc[2]]),0.1,color='blue')

title = 'xDirection= '+str(xDir)+',  in_planeDirection= '+str(pDir)
minmax, width = (-1,1), 5
fig = plt.figure(figsize=(width, width/2))
fig.text(0.9,0.01,'Figure 4', fontsize='x-small')
fig.text(0.5,0.975,title, ha='center', va='top', fontsize='smaller')
ax1 = fig.add_subplot(121, projection='3d')
ax2 = fig.add_subplot(122, projection='3d')
ax1.set(xlim=minmax, ylim=minmax, zlim=minmax)
ax2.set(xlim=minmax, ylim=minmax, zlim=minmax)
s3d.standardAxis( ax1, negaxis=True )
s3d.standardAxis( ax2, offset=0.5, negaxis=True )

tl,ty,tz = 1.1, 1.2, 1.3
tx_x,ty_x,tz_x =  tl*xDir[0],tl*xDir[1],tl*xDir[2]
tx_p,ty_p,tz_p =  tl*pDir[0],tl*pDir[1],tl*pDir[2]
tx_y,ty_y,tz_y =  ty*unitDirc[1][0],ty*unitDirc[1][1],ty*unitDirc[1][2]
tx_z,ty_z,tz_z =  tz*unitDirc[2][0],tz*unitDirc[2][1],tz*unitDirc[2][2]

ax1.text(tx_x,ty_x,tz_x,"x'", color = 'red', fontsize='large',
            horizontalalignment='center', verticalalignment='center')
ax2.text(tx_x,ty_x,tz_x,"x'", color = 'red', fontsize='large',
            horizontalalignment='center', verticalalignment='center')
ax1.text(tx_p,ty_p,tz_p,"p'", color = 'red', fontsize='large',
            horizontalalignment='center', verticalalignment='center')
ax1.text(tx_y,ty_y,tz_y,"y'", color = 'green', fontsize='large',
            horizontalalignment='center', verticalalignment='center')
ax1.text(tx_z,ty_z,tz_z,"z'", color = 'blue', fontsize='large',
            horizontalalignment='center', verticalalignment='center')

ax1.add_collection3d(grid)

surface = surface+gplane
surface.set_linewidth(0.25)
ax2.add_collection3d(surface)
ax1.add_collection3d(vfx)
ax1.add_collection3d(vfp)
ax1.add_collection3d(vfy)
ax1.add_collection3d(vfz)
ax2.add_collection3d(vfx2)

fig.tight_layout()

# =======================================================================================
plt.show()