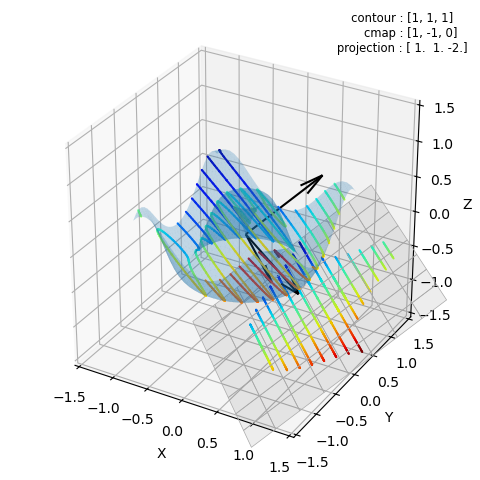
General Surface Contour Projections

Different direction vectors are used for the planar contour normals, the color mapping directions of the contours and the planar projection directions of the contours.
import copy
import numpy as np
import matplotlib.pyplot as plt
import s3dlib.surface as s3d

# general projected colored contours

# 1. Define functions to examine ....................................
contourDirc, cmapDirc = [1,1,1] , [1,-1,0]

def wavefunc(xyz) :
    x,y,z = xyz
    r = np.sqrt( x**2 + y**2)
    Z = np.sin( 6.0*r )/2
    return x,y,Z

unitDirc = s3d.vectRot(contourDirc,cmapDirc)
projectionDirc = unitDirc[2]

# 2. Setup and map surfaces .........................................
rez = 5

surface = s3d.PlanarSurface(rez)
surface.map_geom_from_op( wavefunc ).set_surface_alpha(.25)

line = surface.contourLineSet(14,direction=contourDirc)
line.map_cmap_from_op(lambda c : np.dot(c.T,cmapDirc),'jet')

projline = copy.copy(line).map_to_plane(1.5,direction=projectionDirc)

grid = s3d.PlanarSurface(2,'squ', color=[0,0,0,0.07],edgecolor='darkgrey',lw=0.5)
grid.transform(unitDirc, scale=1.5).transform(translate=1.55*projectionDirc)

vf = s3d.Vector3DCollection( np.zeros( [3,3]), 1.2*unitDirc, color='k' )

title = '     contour : '+ str(contourDirc) +'    \ncmap : ' + str(cmapDirc) + \
        '   \nprojection : '+ str(projectionDirc/projectionDirc[1])

# 3. Construct figure, add surfaces, and plot ......................
minmax = (-1.5,1.5)
fig = plt.figure(figsize=plt.figaspect(1))
fig.text(0.975,0.975,title, ha='right', va='top', fontsize='smaller', multialignment='right')
ax = plt.axes(projection='3d', aspect='equal')
ax.set(xlim=minmax, ylim=minmax, zlim=minmax,
    xlabel='X', ylabel='Y', zlabel='Z')

ax.add_collection3d(surface)
ax.add_collection3d(line)
ax.add_collection3d(projline)
ax.add_collection3d(grid)
ax.add_collection3d(vf)

fig.tight_layout(pad=2)
plt.show()
