
Cylindrical Contours
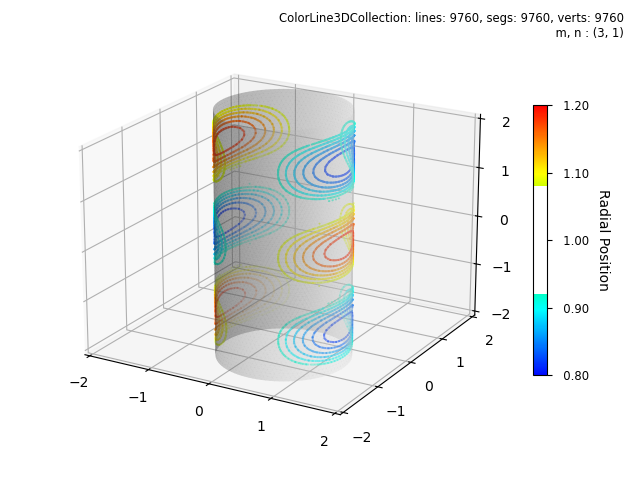
In this example, cylindrical contour planes are obtained from the geometry of the surface given in the Surface Displacements in Cylindrical Coordinates example. The gapped colormap is used to emphasize the minimum and maximum values.
import numpy as np
from matplotlib import pyplot as plt
from matplotlib.ticker import LinearLocator, FormatStrFormatter
import s3dlib.surface as s3d
import s3dlib.cmap_utilities as cmu

#.. Surface Displacements Contours in Cylindrical Coordinates

# 1. Define functions to examine ....................................

n,m = 1,3
Um, Vm, Wm = 0.2, 0.1, 0.2
cyLen = 2.5

def displacements(rtz) :
    r,t,z = rtz
    Z = np.pi*z/2
    Z = Z/cyLen
    u = Um*np.cos(n*t)*np.cos(m*Z)
    v = Vm*np.sin(n*t)*np.sin(m*Z)
    w = Wm*np.cos(n*t)*np.sin(m*Z)
    return [u, v, w]

def newCoor(rtz) :
    r,t,z = rtz
    u, v, w = displacements(rtz)
    R = r + u
    T = t + v/r  # small angle displacements:  v ~ r*dt
    Z = z + w
    return R,T,Z

only_R_coor = lambda c : [ c[0]+displacements(c)[0] ,c[1], c[2] ]

def alphaGap(t) :
    br = cmu.hsv_cmap_gradient([0.66,1,1],[0,1,1] )
    r,g,b,a = br(t).T
    gap = np.logical_and( t>0.3, t<0.7 )
    a = np.where(gap,np.zeros(a.shape),np.ones(a.shape))
    return r,g,b,a

# 2. Setup and map surfaces .........................................
rez = 5
br_gapped = cmu.op_cmap(alphaGap)

cylinder = s3d.CylindricalSurface(rez,basetype='tri', cmap=br_gapped).domain(zlim=cyLen)
cylinder.map_geom_from_op(only_R_coor)
cylinder.map_cmap_from_op()

contours = cylinder.contourLineSet(20)
contours.map_to_plane(1,coor='c')

tube = s3d.CylindricalSurface(rez,basetype='tri', color='w').domain(zlim=cyLen)
tube.set_surface_alpha(.3)

# 3. Construct figure, add surfaces, and plot .....................

fig = plt.figure(figsize=plt.figaspect(0.75))
info = '{}\n m, n : ({}, {})'.format(str(contours), str(m) , str(n))
fig.text(0.975,0.975,info, ha='right', va='top', fontsize='smaller', multialignment='right')
ax = plt.axes(projection='3d')
mnmx = [-2,2]
ax.set(xlim=mnmx, ylim=mnmx, zlim=mnmx )
ax.xaxis.set_major_locator(LinearLocator(5))
ax.yaxis.set_major_locator(LinearLocator(5))
ax.zaxis.set_major_locator(LinearLocator(5))
minc = cylinder.bounds['vlim'][0]
maxc = cylinder.bounds['vlim'][1]
cbar = plt.colorbar(cylinder.cBar_ScalarMappable, ax=ax, ticks=np.linspace(minc,maxc,5), shrink=0.6 )
cbar.set_label('Radial Position', rotation=270, labelpad = 15)
cbar.ax.tick_params(labelsize='small')
cbar.ax.yaxis.set_major_formatter(FormatStrFormatter('%6.2f'))
ax.view_init(elev=20)

ax.add_collection3d(contours.fade())
ax.add_collection3d(tube.shade())

fig.tight_layout()
plt.show()