
Contour Coloring
Surface contours can be colored using two different approaches:
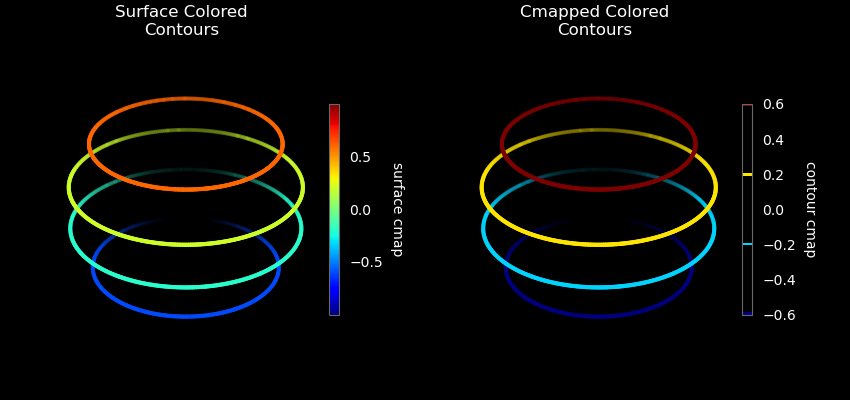
The default contour color is taken from the surface color.
Color mapping methods may be applied to the contour line object.
The two methods are similar but will result in a different visualization of both the contour coloring and the resulting applied color bar. Which approach is used depends on the intended visualization. This example demonstrates both approaches for four contours on a sphere. The same colormap and applied direction are used for both cases, with the surface object not shown.
import numpy as np
from matplotlib import pyplot as plt
import s3dlib.surface as s3d

#.. Colored Contours

# 1. Define functions to examine ....................................

def zDir(rtp) : return s3d.SphericalSurface.coor_convert(rtp,True)[2]

# 2. Setup and map surfaces .........................................
rez = 6

surface= s3d.SphericalSurface(rez)
surface.map_cmap_from_op(zDir,'jet',cname='surface cmap' )
surfLine = surface.contourLineSet(4,coor='p',name='Surface Colored\nContours')
surfLine.set_linewidth(3)

cmapLine = surface.contourLineSet(4,coor='p',name='Cmapped Colored\nContours')
cmapLine.map_cmap_from_op(lambda xyz : xyz[2], 'jet',cname='contour cmap')
cmapLine.set_linewidth(3)

# 3. Construct figure, add surfaces, and plot ......................

minmax = (-.8,0.8)
fig = plt.figure(figsize=[8.5,4],facecolor='k')

ax1 = fig.add_subplot(121, projection='3d', facecolor='k', aspect='equal')
ax1.set(xlim=minmax, ylim=minmax, zlim=minmax )
ax1.set_axis_off()
ax1.set_title(surfLine.name,color='w')

ax2 = fig.add_subplot(122, projection='3d', facecolor='k', aspect='equal')
ax2.set(xlim=minmax, ylim=minmax, zlim=minmax )
ax2.set_axis_off()
ax2.set_title(cmapLine.name,color='w')

cbar1 = plt.colorbar(surface.cBar_ScalarMappable, ax=ax1,  shrink=0.6, pad=-.05 )
cbar1.outline.set_edgecolor('dimgrey')
cbar1.set_label(surface.cname, rotation=270, labelpad = 15, color='w')
plt.setp(plt.getp(cbar1.ax.axes, 'yticklabels'), color='w')

cbar2 = plt.colorbar(cmapLine.stcBar_ScalarMappable(4), ax=ax2, shrink=0.6, pad=-.05 )
cbar2.outline.set_edgecolor('dimgrey')
cbar2.set_label(cmapLine.cname, rotation=270, labelpad = 15, color='w')
plt.setp(plt.getp(cbar2.ax.axes, 'yticklabels'), color='w')

ax1.add_collection3d(surfLine.fade())
ax2.add_collection3d(cmapLine.fade())

fig.tight_layout(pad=1.1)
plt.show()