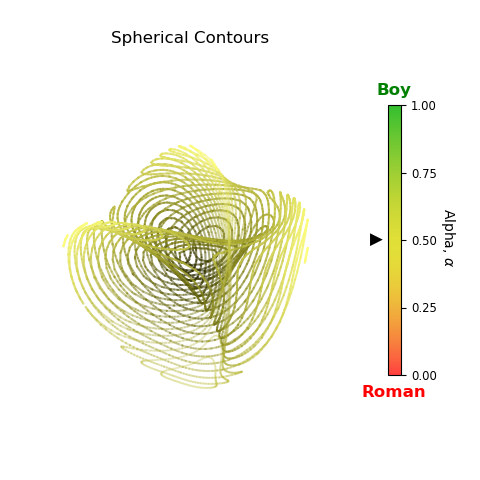
Boy to Roman Contour Animation

Animation control:
Visualization |
Frame Value |
|---|---|
Surface geometry |
functional parameter per frame |
Surface position |
functional z-coordinate axis parameter per frame |
Contour Line color |
color per frame |
Shading and highlighting |
fixed to the coordinate axis |
Axis coordinate |
constant |
Based on the static plots from the Boy Surface, Planar to XYZ and Spherical Coordinates to XYZ examples.
The Boy and Roman surfaces are homotopic. With a single parameters for the transformation, this animation was fairly straightforward. The only difficulty was parameterizing the scale and center of the surfaces with the homotopic transformation parameter, alpha. Spherical contours of the surfaces were used instead of the surface geometry, highlighting the symmetry of the Roman surface.
import numpy as np
import matplotlib.pyplot as plt
from matplotlib.animation import FuncAnimation
import s3dlib.surface as s3d
import s3dlib.cmap_utilities as cmu

#.. Homotopy Boy to Roman Surface Animation
# https://mathworld.wolfram.com/BoySurface.html

# 0. Define animation control parameters ............................

totalTime, f_domain, numFrames = 9, (0.0,1.0), 100   # time in seconds
frames=np.linspace(*f_domain, numFrames, endpoint=False)
interval = int(1000.0*totalTime/numFrames)          # milliseconds

# 1. Define functions to examine ....................................
f = 0.6                   # axis scaling
zoffset = 1.25*f +.25     # surfaces offset
B2R = 0.5                 # size scaling Boy to Roman
nCntrs = 18               # number of contours
elev, azim = 20, -40

def boy_roman(xyz,alp) :
    x,y,z = xyz
    u = 0.5*(x+1)*np.pi
    v = 0.5*(y+1)*np.pi
    sr2 = np.sqrt(2)
    cv2 = np.cos(v)*np.cos(v)
    denom = 2 - alp*sr2*np.sin(3*u)*np.sin(2*v)
    X = ( sr2*np.cos(2*u)*cv2 + np.cos(u)*np.sin(2*v) )/denom
    Y = ( sr2*np.sin(2*u)*cv2 - np.sin(u)*np.sin(2*v) )/denom
    Z = 3*cv2/denom
    reduc = (B2R-1)*alp +1
    X *=reduc
    Y *=reduc
    Z *=reduc
    return X,Y,Z-zoffset

def colormap_by_A(alp) :
    lowH, hiH = 0,0.33
    hue = (hiH-lowH)*alp + lowH
    return cmu.hsv_cmap_gradient( [hue,1.0,0.15], [hue,0.5,1],smooth=1.6)

def indicator_by_A(fig, A, vOld=None) :
    symbol, blank = r'$\blacktriangleright$', r'$\blacksquare$'
    horz, vBot, vRng = 0.8, 0.22, 0.56
    vert = vBot + vRng*A
    if vOld is not None:
        fig.text(horz,vOld,blank, ha='right', va='center', fontsize='x-large', color='w')
    fig.text(horz,vert,symbol, ha='right', va='center', fontsize='large')
    return vert

def from_center(xyz,alp) :
    x,y,z = xyz
    ofset = (B2R-1)*alp + 1 - zoffset
    XYZ = np.array([x,y,z-ofset])
    r,t,p = s3d.SphericalSurface.coor_convert(XYZ)
    return r

def frame_2_alpha(frmIndex) :
    return( 1 + np.sin(2*np.pi*frmIndex)) / 2

# 2. Setup and map surfaces .........................................

rez = 5
cmap2=cmu.hsv_cmap_gradient( [0.0,0.75,1], [0.33,0.75,0.75],smooth=1.6)

frm = 0
alpha = frame_2_alpha(frm)
surface = s3d.PlanarSurface(rez,'oct1' )
surface.map_geom_from_op( lambda xyz: boy_roman(xyz,alpha) )
cmap = colormap_by_A(alpha)
conline = surface.contourLineSet(nCntrs,coor='s')
conline.map_cmap_from_op( lambda xyz: from_center(xyz,alpha),cmap)
conline.fade(0.1, elev,azim)

dummy = s3d.PlanarSurface(cmap=cmap2 )
dummy._bounds['vlim'] = [0,1]

# 3. Construct figures, add surface, plot ...........................

fig = plt.figure(figsize=plt.figaspect(1))
fig.text(0.82,0.828,'Boy' , ha='center', va='top', fontsize='large',color='g',weight='bold')
fig.text(0.82,0.167,'Roman' , ha='center', va='bottom', fontsize='large',color='r',weight='bold')
ax = plt.axes(projection='3d', aspect='equal')
ax.set_title("Spherical Contours")
cbar = plt.colorbar(dummy.cBar_ScalarMappable, ax=ax, ticks=np.linspace(0,1,5), shrink=0.6 )
cbar.set_label(r'Alpha, $\alpha$  ', rotation=270, labelpad = 15)
cbar.ax.tick_params(labelsize='small')
# ....
f = 0.6
minmax = (-f,f)
ax.set(xlim=minmax, ylim=minmax, zlim=minmax )
ax.view_init(elev,azim)
ax.set_axis_off()
prevIndicator = indicator_by_A(fig, alpha)

ax.add_collection3d(conline)

fig.tight_layout()
#plt.show()

# 4. Animation ......................................................

def update_fig(frame):
    global conline
    global prevIndicator
    conline.remove()

    alpha = frame_2_alpha(frame)

    surface = s3d.PlanarSurface(rez,'oct1' )
    surface.map_geom_from_op( lambda xyz: boy_roman(xyz,alpha) )
    cmap = colormap_by_A(alpha)
    conline = surface.contourLineSet(nCntrs,coor='s')
    conline.map_cmap_from_op( lambda xyz: from_center(xyz,alpha),cmap)
    conline.fade(0.1,elev,azim)

    prevIndicator = indicator_by_A(fig, alpha, prevIndicator)
    ax.add_collection3d(conline)

    return conline,

anim = FuncAnimation(fig, update_fig, frames, interval=interval, repeat=True)
anim.save('boy2roman_contours.html',writer='html')

msg = "saved {} frames, values: [{:.3f} to {:.3f}] @ {} milliseconds/frane"
print(msg.format(numFrames,np.min(frames),np.max(frames),interval))
