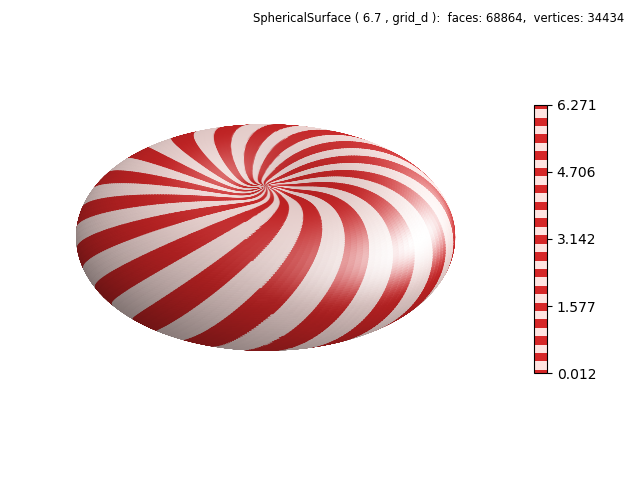
import numpy as np
from matplotlib import pyplot as plt
import s3dlib.surface as s3d
import s3dlib.cmap_utilities as cmu

#.. Compound Color Maps

# 1. Define functions to examine ....................................

def flatten(rtp,twists) :
    r,t,p = rtp
    flat = 0.7
    T = t - twists*( p )
    R = (1-flat)*r + flat*(np.sin(p))**4
    return R,T,p

# 2. Setup and mapsurfaces .........................................

cmap = cmu.binary_cmap('tab:red','mistyrose')
cmap = cmu.mirrored_cmap(cmap)
cmap = cmu.mirrored_cmap(cmap)
cmap = cmu.mirrored_cmap(cmap)
cmap = cmu.mirrored_cmap(cmap)
cmap = cmu.mirrored_cmap(cmap)

surface = s3d.SphericalSurface.grid(270,32*4, cmap=cmap)
surface.map_cmap_from_op( lambda rtp : rtp[1] )
surface.map_geom_from_op( lambda rtp : flatten(rtp,1) )

# 3. Construct figure, addsurfaces, and plot ......................

fig = plt.figure(figsize=plt.figaspect(0.75))
fig.text(0.975,0.975,str(surface), ha='right', va='top', fontsize='smaller', multialignment='right')
ax = plt.axes(projection='3d')
minmax = (-.7,0.7)
ax.set(xlim=minmax, ylim=minmax, zlim=minmax )
minc = surface.bounds['vlim'][0]
maxc = surface.bounds['vlim'][1]
plt.colorbar(surface.cBar_ScalarMappable, ax=ax, ticks=np.linspace(minc,maxc,5), shrink=0.6 )
ax.set_axis_off()

ax.add_collection3d(surface.shade(0.5,[1,1,1]).hilite())

fig.tight_layout()
plt.show()

