
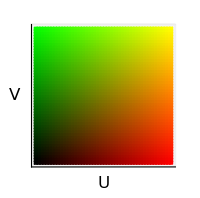
U,V Value DualCmap
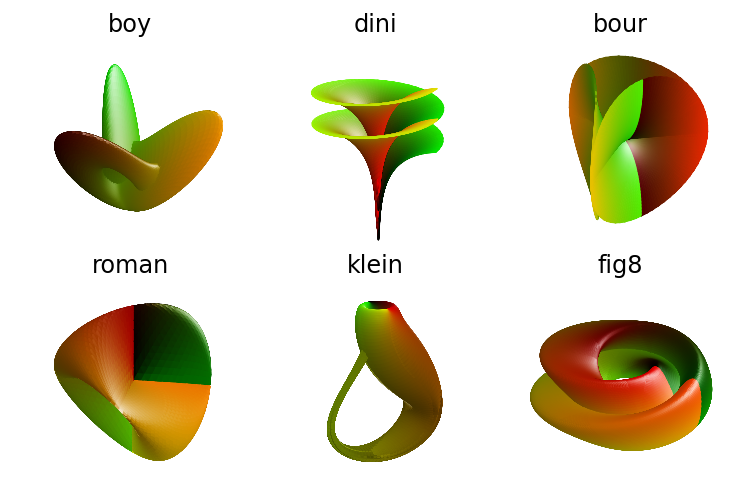
The DualCmap object is used to show the u,v parameter values in the surface:
REOM: 1
import numpy as np
from matplotlib import pyplot as plt
import s3dlib.surface as s3d
import s3dlib.cmap_utilities as cmu

#.. parameter u,v DualCmap colormap

# 1. Define functions to examine ...................................
def boy(xyz) :
    x,y,z = xyz      # u,v => x,y
    u = np.pi*x/2
    v = np.pi*(1+y)/2
    X = (np.sqrt(2)*(np.cos(v)*np.cos(v))*np.cos(2*u) + np.cos(u)*np.sin(2*v))/(2 - np.sqrt(2)*np.sin(3*u)*np.sin(2*v))
    Y = (np.sqrt(2)*(np.cos(v)*np.cos(v))*np.sin(2*u) - np.sin(u)*np.sin(2*v))/(2 - np.sqrt(2)*np.sin(3*u)*np.sin(2*v))
    Z = (3*(np.cos(v)*np.cos(v)))/(2 - np.sqrt(2)*np.sin(3*u)*np.sin(2*v))
    Z -= 2  # added offset for axis position.
    return X,Y,Z

def dini(rtz) :
    r,t,z = rtz      # u,v => t,r
    a, b = 1, 0.2
    T = 2*t
    x = a*np.cos(T)*np.sin(r)
    y = a*np.sin(T)*np.sin(r)
    z = a*(np.cos(r) + np.log(np.tan(r/2))) + b*T
    return x,y, 0.333*z    # note: scale.z

def bour(rtz) :
    r,t,z = rtz      # u,v => r,t
    T = 2*t
    x = r*np.cos(T) - np.power(r,2.0)*np.cos(2*T)/2.0
    y = -r*np.sin(T) * ( r*np.cos(T) + 1.0)
    z = 1.3333*np.power(r,1.5)*np.cos(1.5*T)
    return x,y,z

def roman(rtp) :
    r,t,p = rtp      # u,v => t,p
    ct, st = np.cos(t), np.sin(t)
    cp, sp = np.cos(p), np.sin(p)
    cp_sp = cp*sp
    ct_st = ct*st
    x = cp*ct_st
    y = sp*ct_st
    z = cp_sp*np.square(ct)
    return x,y,z

def klein(rtp) :
    r,t,p = rtp      # u,v => p,t
    u = p
    v = t
    cU, sU = np.cos(u), np.sin(u)
    cV, sV = np.cos(v), np.sin(v)
    x = -(2/15)*cU* \
        (  ( 3 )*cV + \
           ( -30 + 90*np.power(cU,4) - 60*np.power(cU,6) + 5*cU*cV )*sU \
        )
    y = -(1/15)*sU* \
        (  ( 3 - 3*np.power(cU,2) -48*np.power(cU,4) +48*np.power(cU,6) )*cV + \
           (-60 + ( 5*cU - 5*np.power(cU,3) - 80*np.power(cU,5) + 80*np.power(cU,7) )*cV  )*sU \
        )
    z = (2/15)*( 3 + 5*cU*sU )*sV
    return x,y,z

def fig8(rtp) :
    r,t,p = rtp      # u,v => t,p
    v = 2*p
    R=2
    Q = ( R + np.cos(t/2)*np.sin(v) - np.sin(t/2)*np.sin(2*v) )
    x = Q*np.cos(t)
    y = Q*np.sin(t)
    z = np.sin(t/2)*np.sin(v) + np.cos(t/2)*np.sin(2*v)
    return x,y,z

# 2. Setup and map surface .........................................
rez = 6
kr = cmu.hsv_cmap_gradient( [0.00,1,0], [0.00,1,1],name='black_red' )
kg = cmu.hsv_cmap_gradient( [0.33,1,0], [0.33,1,1],name='black_green' )
cmap2d = cmu.DualCmap(kr,kg)

boyS = s3d.PlanarSurface(rez, basetype='oct1')
boyuv = lambda xyz : cmap2d(xyz[0],xyz[1])

diniS = s3d.PolarSurface(rez-1, basetype='hex_c', minrad=0.01)
diniuv = lambda rtz : cmap2d(rtz[1],rtz[0])

bourS = s3d.PolarSurface(rez, basetype='hex_c')
bouruv = lambda rtz : cmap2d(rtz[0],rtz[1])

romanS = s3d.SphericalSurface(rez-1,basetype='octa_c',minrad=0.01)
romanuv = lambda rtp : cmap2d(rtp[1],rtp[2])

kleinS = s3d.SphericalSurface(rez,basetype='octa_c',minrad=0.01)
kleinuv = lambda rtp : cmap2d(rtp[2],rtp[1])

fig8S = s3d.SphericalSurface(rez,basetype='octa_c')
fig8uv = lambda rtp : cmap2d(rtp[1],rtp[2])

surfaces = [ boyS,  diniS,  bourS,  romanS,  kleinS,  fig8S ]
geomFunc = [ boy,   dini,   bour,   roman,   klein,   fig8 ]
colorLam = [ boyuv, diniuv, bouruv, romanuv, kleinuv, fig8uv ]
elevazim = [ None,       [20,-60],    [30,-40], [20,-80],     [20,-125],  [35,-60] ]
minmaxAr = [ [-1.4,1.4], [-0.75,.75], [-1,1],   [-.375,.375], [-1.5,1.5], [-2,2]   ]

# 3. Construct figure, add surface plot ............................

fig = plt.figure(figsize=(7.5,5))

for i,surface in enumerate(surfaces) :
    ax = fig.add_subplot(231+i, projection='3d', aspect='equal')
    ax.set_axis_off()
    minmax, elaz = minmaxAr[i], elevazim[i]
    ax.set(xlim=minmax, ylim=minmax, zlim=minmax)
    if elaz is not None : ax.view_init(*elaz)
    geomF, colorUV = geomFunc[i], colorLam[i]
    surface.map_geom_from_op(  geomF, returnxyz=True )
    surface.map_color_from_op( colorUV )
    if i==4 : surface.transform(s3d.eulerRot(0,-90),translate=[0,0,2])
    ax.set_title(surface.name , fontsize='xx-large')
    ax.add_collection3d(surface.shade(.5,ax=ax).hilite(0.8,focus=1.5,ax=ax))

fig.tight_layout()
plt.show()