
Complex Number DualCmap
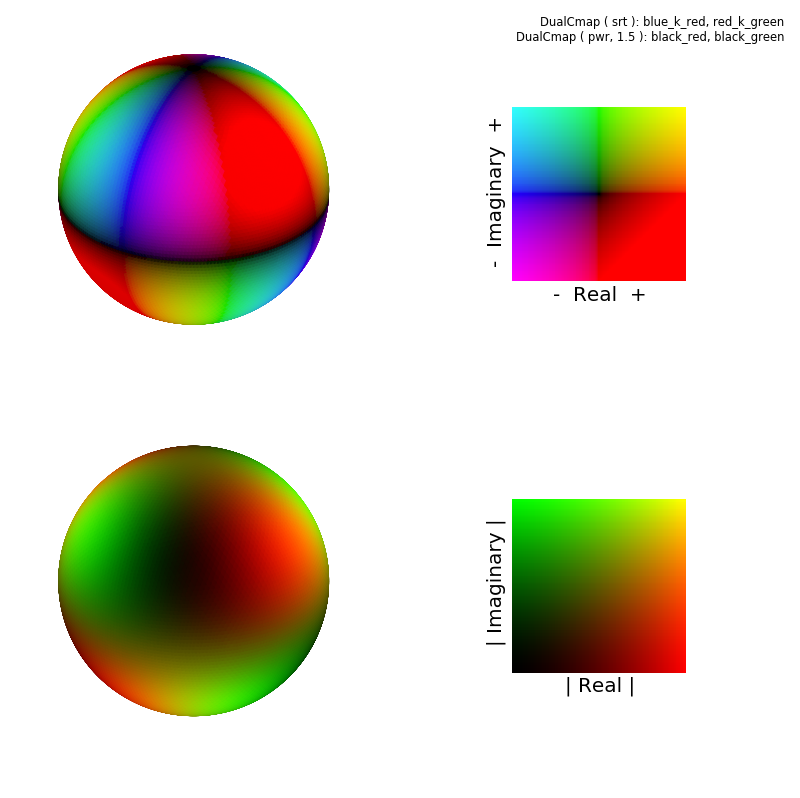
The DualCmap objects were constructed from the following colormaps.

import numpy as np
from scipy import special as sp
from matplotlib import pyplot as plt
import s3dlib.surface as s3d
import s3dlib.cmap_utilities as cmu

#.. Complex Number Representation, Dual Colormaps

# 1. Define function to examine .....................................

bk = cmu.hsv_cmap_gradient( [0.67,1,1], [0.67,1,0] )
kr = cmu.hsv_cmap_gradient( [0.00,1,0], [0.00,1,1], name='black_red' )
rk = cmu.hsv_cmap_gradient( [0.00,1,1], [0.00,1,0] )
kg = cmu.hsv_cmap_gradient( [0.33,1,0], [0.33,1,1], name='black_green' )
bkr = cmu.stitch_cmap(bk,kr, name='blue_k_red')
rkg = cmu.stitch_cmap(rk,kg, name='red_k_green')

cmap2d = [None]*2
cmap2d[0] = cmu.DualCmap(bkr,rkg,'srt')
cmap2d[1] = cmu.DualCmap(kr,kg,1.5)

# ............................................................
real = True
imaginary =  not real

def sphHar(rtp, isReal) :
    r, theta, phi = rtp
    m, n = 2,3
    sph = sp.sph_harm(m, n, theta, phi)
    if isReal : r = sph.real
    else :      r = sph.imag
    return r, theta, phi

def rgb_complex(rtp,dcmap) :
    Z_real = sphHar(rtp,real)[0]
    Z_img  = sphHar(rtp,imaginary)[0]
    return dcmap(Z_real,Z_img)

# ............................................................
N = 200
x=np.linspace(0,1,N)
y=np.linspace(0,1,N)

# 3. Construct figures, add surface, plot ...........................
rez = 6
info = str(cmap2d[0]) +'\n' + str(cmap2d[1])
minmax1,minmax2 = (-0.8,0.8), (-0.5*N,1.5*N)
fig = plt.figure(figsize=(8,8))
fig.text(0.98,0.98,info, ha='right', va='top', fontsize='smaller', multialignment='right')

for i in range(2) :
    sph_23 = s3d.SphericalSurface(rez, basetype='octa')
    sph_23.map_color_from_op( lambda c : rgb_complex(c,cmap2d[i]) )
    z = cmap2d[i](*np.meshgrid(x, y)).T

    rowNumb = 221 + 2*i
    ax1 = fig.add_subplot(rowNumb, projection='3d', aspect='equal')
    ax1.set(xlim=minmax1, ylim=minmax1, zlim=minmax1 )
    ax1.set_axis_off()
    ax1.add_collection3d(sph_23.shade(.8))

    ax2 = fig.add_subplot(rowNumb+1, aspect='equal')
    vPosR = 0.12 if i==0 else 0.61
    ax2.set(xlim=minmax2, ylim=minmax2 )
    ax2.set_axis_off()
    ax2.imshow(z)

    realstr = '| Real |'      if i==0 else '-  Real  +'
    imgstr  = '| Imaginary |' if i==0 else '-  Imaginary  +'
    fig.text(0.74,vPosR,     realstr, ha='center', va='center', fontsize='x-large')
    fig.text(0.61,vPosR+0.13,imgstr,  ha='center', va='center', fontsize='x-large', rotation=90)

fig.tight_layout()
plt.show()