
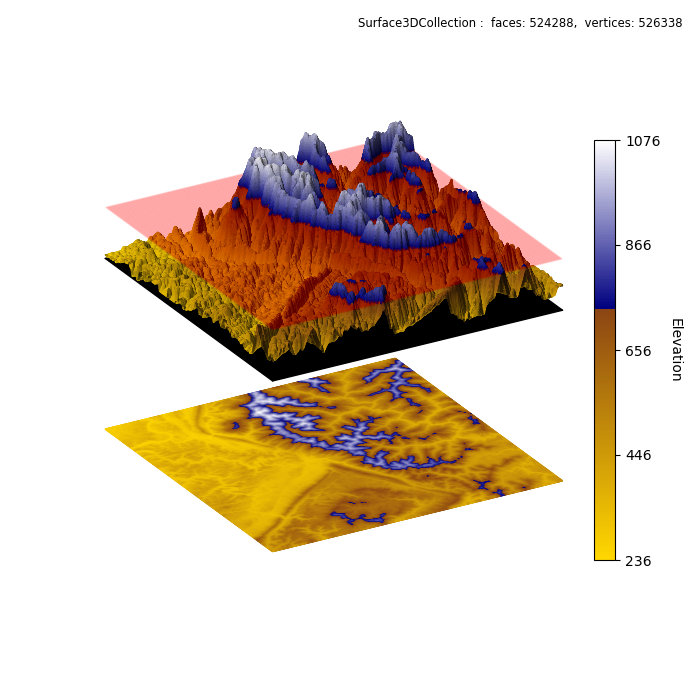
Surface Sectioning
REOM: 1
from time import time
import copy
import numpy as np
import matplotlib.pyplot as plt
import s3dlib.surface as s3d
import s3dlib.cmap_utilities as cmu

#.. Binary cmap to show zone.

# 1. Define function to examine .....................................

Z=np.load('data/jacksboro_fault_dem.npz')['elevation']
datagrid = np.flip(Z,0)

# 2. Setup and map surfaces .........................................
rez, scale, zone = 8, 0.75, 0.60

gb = cmu.rgb_cmap_gradient('gold','saddlebrown')
bw = cmu.rgb_cmap_gradient('navy','white')
bcmap = cmu.stitch_cmap(gb,bw,bndry=zone)

surface = s3d.PlanarSurface(rez, basetype='squ', cmap=bcmap)
surface.map_cmap_from_datagrid( datagrid )
csm = surface.cBar_ScalarMappable
minc, maxc = surface.bounds['vlim']
surface.map_geom_from_datagrid( datagrid, scale=scale)

flat_surf = copy.copy(surface)
# flatten and move down to -1
flat_surf.map_geom_from_op(lambda c: [c[0],c[1],-np.ones_like(c[0])] )

surface.shade(contrast=1.3)
zplane = s3d.PlanarSurface(rez, basetype='squ',color=[1,0,0,0.02]).domain(zcoor=scale*zone)
surface = surface + zplane
surface.transform(translate=[0,0,0.5])  # move up to 0.5

# 3. Construct figure, add surface, plot ............................

minmax=(-1.2,1.2)
fig = plt.figure(figsize=(7,7))
fig.text(0.975,0.975,str(surface), ha='right', va='top',
        fontsize='smaller', multialignment='right')
ax = plt.axes(projection='3d')
ax.set(xlim=minmax, ylim=minmax, zlim=minmax, )
cbar=plt.colorbar(csm, ax=ax,
        ticks=np.linspace(minc,maxc,5), shrink=0.6, pad=-.08  )
cbar.set_label('Elevation', rotation=270, labelpad = 15)
ax.set_axis_off()
ax.set_proj_type('ortho')
ax.view_init(elev=25, azim=60)

ax.add_collection3d(surface)
ax.add_collection3d(s3d.PlanarSurface(color='k').domain(zcoor=0.5))
ax.add_collection3d(flat_surf)

fig.tight_layout(pad=0)
plt.show()