
Custom Colormap
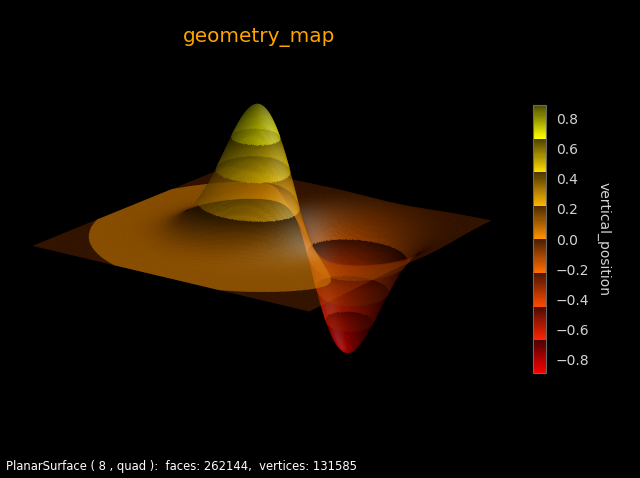
The custom colormap was constructed using the procedural steps:
Create a linear cmap from red to yellow.
Extract eight colors from the cmap.
Construct an eight-element list.
Create a linear cmap from each color, varying alpha from 1 to 0.
Set the eight cmaps to the list elements.
Create a stitch cmap from the list elements.
Matplotlib colorbars do not show transparent colors on the figure background but use a white background. For this reason, a similar colormap was constructed for the colorbar but using colors varying hsv Values from 1 to 0.3.

import numpy as np
from matplotlib import pyplot as plt
import s3dlib.surface as s3d
import s3dlib.cmap_utilities as cmu
import matplotlib.colors as colors
from matplotlib import colormaps

#.. Alpha gradient colormap demo

# 1. Define function to examine .....................................

def geometry_map(xyz) :
    x,y,z = xyz
    X,Y = 3*x, 3*y
    Z1 = np.exp(-X**2 - Y**2)
    Z2 = np.exp(-(X - 1)**2 - (Y - 1)**2)
    Z = Z1-Z2
    return x,y,Z

def vertical_position(xyz) :
    x,y,z = xyz
    return z

#... custom colormap with alpha gradients .....
ry = cmu.hsv_cmap_gradient('red','yellow')
eightColors = colormaps.get_cmap(ry)(np.linspace(0, 1, 8))
ca =[None]*8
cb =[None]*8
alpha = 0.3
for i in range(8) :
    eightColorsALpha = colors.to_rgba(eightColors[i],alpha)
    ca[i] = cmu.rgb_cmap_gradient(eightColors[i], eightColorsALpha )
    h,s,v = colors.rgb_to_hsv(colors.to_rgb(eightColors[i]))
    cb[i] = cmu.hsv_cmap_gradient( [h,s,v], [h,s,alpha] )

cmapAlpha = cmu.stitch_cmap( *ca )
cmapBlack = cmu.stitch_cmap( *cb )

# 2. Setup and map surfaces .........................................
rez = 8

surface = s3d.PlanarSurface(rez,cmap=cmapAlpha,lw=0)
surface.map_geom_from_op( geometry_map )
surface.map_cmap_from_op( vertical_position )

# 3. Construct figure, add surface, plot ............................

fig = plt.figure(figsize=plt.figaspect(0.75),facecolor='k')
fig.text(0.01,0.01,str(surface), ha='left', va='bottom',
    color='w', fontsize='smaller')
ax = plt.axes(projection='3d',facecolor='k')
minmax = ( -0.8,0.8 )
ax.set(xlim=minmax, ylim=minmax, zlim=minmax )
ax.set_axis_off()
ax.view_init(20,-55)
ax.set_title(surface.name,color='orange', fontsize='x-large')

surface.cmap = cmapBlack #.. used for colorbar, but not surface coloring
cbar = plt.colorbar(surface.cBar_ScalarMappable, ax=ax,  shrink=0.6 )
cbar.set_label(surface.cname, rotation=270, labelpad = 15, color='lightgray')
cbar.outline.set_edgecolor('dimgray')
plt.setp(plt.getp(cbar.ax.axes, 'yticklabels'), color='lightgray')

ax.add_collection3d(surface.shade().hilite(.5))

fig.tight_layout()
plt.show()