
Vertex Value Contour Projections
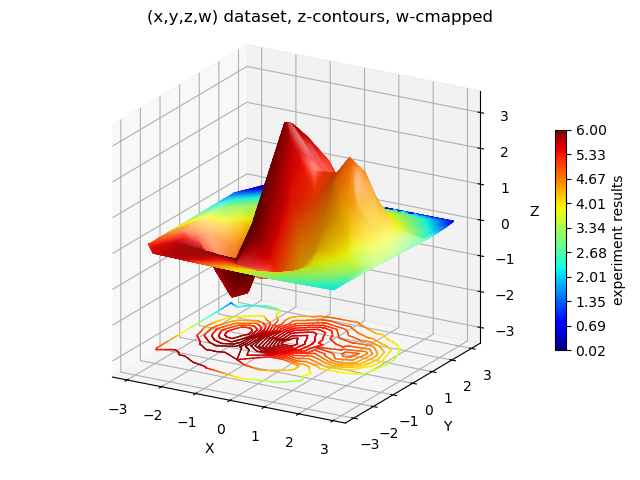
This example is similar to the Contour Projections example with the addition of scalar values included to each vertex coordinate. Contour linecolors default to the color of the surface from which they are constructed. The shape of the contour lines reflect the z-coordinate projection whereas the colormapping is based on the vertex scalar values.
import numpy as np
import matplotlib.pyplot as plt
import s3dlib.surface as s3d

#..  Z direction contours, W surface colormapping.

# 1. Create dataset ................................................

def experiment_res(x, y):
    """An analytic function representing experiment results."""
    x = 2 * x
    r1 = np.sqrt((0.5 - x)**2 + (0.5 - y)**2)
    theta1 = np.arctan2(0.5 - x, 0.5 - y)
    r2 = np.sqrt((-x - 0.2)**2 + (-y - 0.2)**2)
    theta2 = np.arctan2(-x - 0.2, -y - 0.2)
    z = (4 * (np.exp((r1/10)**2) - 1) * 30 * np.cos(3 * theta1) +
         (np.exp((r2/10)**2) - 1) * 30 * np.cos(5 * theta2) +
         2 * (x**2 + y**2))
    return (np.max(z) - z) / (np.max(z) - np.min(z))

np.random.seed(3)
x = np.random.uniform(-3, 3, 256)
y = np.random.uniform(-3, 3, 256)
z = (1 - x/2 + x**5 + y**3) * np.exp(-x**2 - y**2)
z=3*z
w = 6*experiment_res(x/3,y/3)  # <-- include vertex values

xyzw = np.array([x,y,z,w])

# 2. Setup and map surface .........................................

surface = s3d.PlanarSurface.pntsurf(xyzw.T)
surface.triangulate(3)
surface.map_cmap_from_vertvals('jet',cname='experiment results')

offset = -3
contours = surface.contourLineSet(15) # default: planar, z-direction
contours.map_to_plane(offset)         # default: planar, z-direction
contours.set_linewidth(1)

# 3. Construct figure, add surface plot ............................

fig = plt.figure()
figTitle = '(x,y,z,w) dataset, z-contours, w-cmapped'
fig.text(0.5,0.98,figTitle, ha='center', va='top', fontsize='large')
ax = plt.axes(projection='3d', aspect='equal', proj_type='ortho')
ax.set( xlabel='X', ylabel='Y', zlabel='Z')
s3d.auto_scale(ax,surface,contours)
ax.view_init(20)
mincmaxc = surface.bounds['vlim']
fig.colorbar(surface.cBar_ScalarMappable, ticks=np.linspace(*mincmaxc,10),
    ax=ax, fraction=0.02, pad=0.07, label=surface.cname, format='%0.2f' )

ax.add_collection3d(surface.shade(0.5,flat=False).hilite(.5,flat=False))
ax.add_collection3d(contours)

fig.tight_layout(pad=1)
plt.show()