
Unstructured 3-D Cartesian Dataset
( x, y, z, w )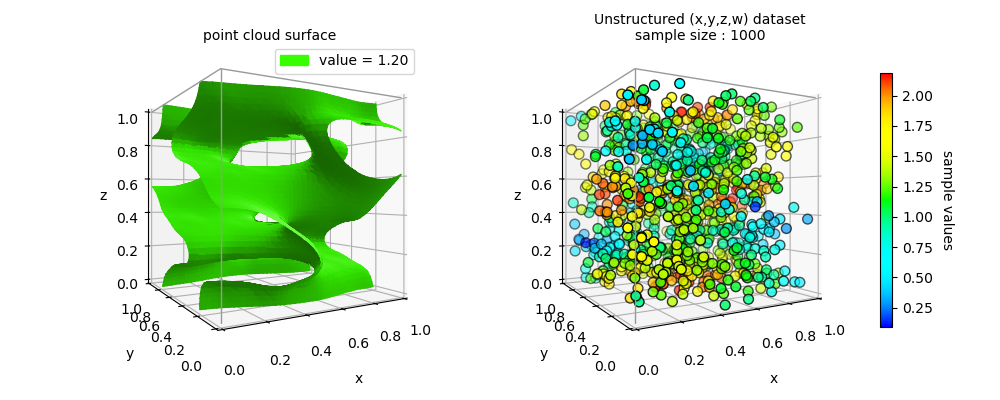
With an unstructured four-value dataset, three values can be used for 3-D coordinates and the fourth value used as a property at each coordinate. Constant property surfaces are constructed from a point cloud within the 3-D domain.
import numpy as np
import matplotlib.pyplot as plt
from matplotlib import cm,colors,colormaps,patches
import s3dlib.surface as s3d
import s3dlib.pntcloud as ptc
import s3dlib.cmap_utilities as cmu

# 1. Get data to examine ...........................................
def get_dataset(N,dmn) :
    np.random.seed(3)
    x = np.random.uniform(*dmn, N)
    y = np.random.uniform(*dmn, N)
    z = np.random.uniform(*dmn, N)
    # u,v,w functions from Mayavi vector field...
    u =    np.sin(np.pi*x) * np.cos(np.pi*z)
    v = -2*np.sin(np.pi*y) * np.cos(2*np.pi*z)
    w = np.cos(np.pi*x)*np.sin(np.pi*z) + np.cos(np.pi*y)*np.sin(2*np.pi*z)
    vector = np.reshape(np.array( [u,v,w] ).T,(-1,3))
    vectMag = np.linalg.norm(vector,axis=1)[:,np.newaxis]
    return x,y,z,vectMag.T[0]

N,domain = 1000, [0,1]
x,y,z,w = get_dataset(N,domain)
samples = np.array([x,y,z,w]).T

# 2. Setup cloud and surface ......................................
drez,vadj,cmap = 4, 'c', cmu.hue_cmap('b','r',2.0,name='BlRd')
Fo = 1.2

cloudObj = ptc.Point3DCloud(drez,domain=domain)
cloudObj.map_vals_from_sampvals(samples,vadj=vadj,cmap=cmap)
cdmn = cloudObj.get_domain()

surface = cloudObj.valsurf( Fo )

# 3. Construct figures, add surfaces, and plot ....................
fig = plt.figure(figsize=(10,4))
# ....................
title = 'point cloud surface'
fig.text(.27,0.9,title,ha='center')
ax = fig.add_subplot(121, projection='3d', aspect='equal', focal_length=0.25)
ax.view_init(0,-120)
ax.set(xlim=domain, ylim=domain, zlim=domain,xlabel='x',ylabel='y',zlabel='z')

ax.add_collection3d(surface.shade(.4,ax=ax).hilite(.5,ax=ax))
s3d.add_boxCorner(ax,cdmn)

c,v,_ = cloudObj.get_color_for_val([Fo])
hnd = patches.Patch(label='value = {:.2f}'.format(v[0]), color=c[0])
ax.legend(handles=[hnd])
# ....................
title = 'Unstructured (x,y,z,w) dataset\nsample size : {}'.format(N)
fig.text(.7,0.9,title,ha='center')
ax = fig.add_subplot(122, projection='3d', aspect='equal', focal_length=0.25)
ax.view_init(0,-120)
ax.set(xlim=domain, ylim=domain, zlim=domain,xlabel='x',ylabel='y',zlabel='z')

ax.scatter(x,y,z, s=50, c=w, cmap=cmap ,edgecolor='k')
s3d.add_boxCorner(ax,cdmn)

norm = colors.Normalize(np.min(w),np.max(w) )
cbar =fig.colorbar(cm.ScalarMappable(norm=norm, cmap=cmap), ax=ax,shrink=0.8, pad=.1)
cbar.set_label('sample values', rotation=270, labelpad = 15)
# ....................

fig.tight_layout(pad=3)
plt.show()