
Datagrid Alternative to Image Construction
This example demonstrates a 3D alternative to viewing data intended for constructing a 2D image. The example uses code directly from a Matplotlib rendering example, as commented in the script.
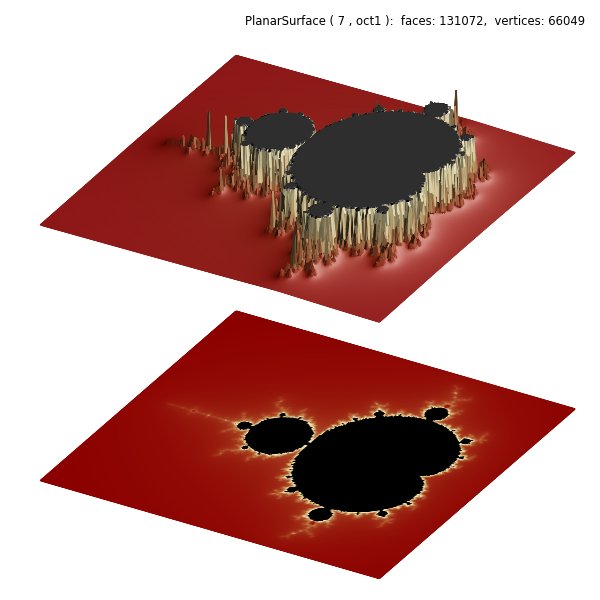
A custom colormap was used which included a black upper region to emphasize the flattened region.

# +----------------------------------------------------------------------------
# |  The following code between the ========= comments was copied DIRECTLY from
# |  https://matplotlib.org/stable/gallery/showcase/mandelbrot.html
# |
# +----------------------------------------------------------------------------
# ===================================================== start of copy.
import numpy as np


def mandelbrot_set(xmin, xmax, ymin, ymax, xn, yn, maxiter, horizon=2.0):
    X = np.linspace(xmin, xmax, xn).astype(np.float32)
    Y = np.linspace(ymin, ymax, yn).astype(np.float32)
    C = X + Y[:, None] * 1j
    N = np.zeros_like(C, dtype=int)
    Z = np.zeros_like(C)
    for n in range(maxiter):
        I = abs(Z) < horizon
        N[I] = n
        Z[I] = Z[I]**2 + C[I]
    N[N == maxiter-1] = 0
    return Z, N


if __name__ == '__main__':
    import time
    import matplotlib
    from matplotlib import colors
    import matplotlib.pyplot as plt

    xmin, xmax, xn = -2.25, +0.75, 3000 // 2
    ymin, ymax, yn = -1.25, +1.25, 2500 // 2
    maxiter = 200
    horizon = 2.0 ** 40
    log_horizon = np.log2(np.log(horizon))
    Z, N = mandelbrot_set(xmin, xmax, ymin, ymax, xn, yn, maxiter, horizon)

    # Normalized recount as explained in:
    # https://linas.org/art-gallery/escape/smooth.html
    # https://www.ibm.com/developerworks/community/blogs/jfp/entry/My_Christmas_Gift

    # This line will generate warnings for null values but it is faster to
    # process them afterwards using the nan_to_num
    with np.errstate(invalid='ignore'):
        M = np.nan_to_num(N + 1 - np.log2(np.log(abs(Z))) + log_horizon)

    # ===================================================== end of copy.
    import copy
    from matplotlib import cm
    from matplotlib.colors import ListedColormap
    import s3dlib.surface as s3d
    import s3dlib.cmap_utilities as cmu

    # 1. Define functions to examine ....................................

    pNorm = lambda x,n : np.power(x,n)
    amax =np.amax(M)
    M = np.where(M<0.1, 1, M/amax)
    datagrid = pNorm(M,0.2)

    def clipZ(xyz) :
        x,y,z = xyz
        return x,y,np.clip(z,0,1)

    # 2. Setup and map surfaces .........................................
    blacktop = cmu.hsv_cmap_gradient('darkred','lemonchiffon')
    blacktop = blacktop(np.linspace(0, 1, 256))
    blacktop[-2:] = np.array( [0,0,0,1] )
    blacktop = ListedColormap(blacktop)
    rez=7

    surface = s3d.PlanarSurface(rez, basetype='oct1', cmap=blacktop)
    surface.map_geom_from_datagrid( datagrid )
    surface.map_geom_from_op(clipZ)
    surface.map_cmap_from_op()

    surface.transform(translate=[0,0,1.0])  # move up to 1.0
    flat_surf = copy.copy(surface)
    # flatten and move down to -2
    flat_surf.map_geom_from_op(lambda c: [c[0],c[1],-2*np.ones_like(c[0])] )

    # 3. Construct figure, add surface, plot ............................

    fig = plt.figure(figsize=(6,6))

    fig.text(0.975,0.975,str(surface), ha='right', va='top',
            fontsize='smaller', multialignment='right')
    ax = plt.axes(projection='3d')
    ax.set(xlim=(-.9,0.9), ylim=(-.9,0.9), zlim=(-1.5,1.5) )
    ax.set_axis_off()
    ax.set_proj_type('ortho')

    ax.add_collection3d(surface.shade().hilite(.6,focus=.5))
    ax.add_collection3d(flat_surf)

    fig.tight_layout()
    plt.show()