
Polar Coordinates to XYZ 2
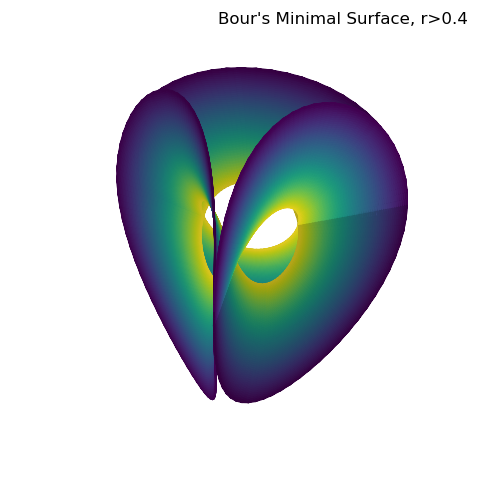
Documentation on Bour’s minimal surface can be found in Wikipedia where this function definition is located.
import numpy as np
from matplotlib import pyplot as plt
import s3dlib.surface as s3d

#.. Polar Coordinates to XYZ 2

# 1. Define function to examine .....................................

def boursurf(rtz) :
    r,t,z = rtz
    T = 2*t
    x = r*np.cos(T) - np.power(r,2.0)*np.cos(2*T)/2.0
    y = -r*np.sin(T) * ( r*np.cos(T) + 1.0)
    z = 1.3333*np.power(r,1.5)*np.cos(1.5*T)
    return x,y,z

# 2. Setup and map surfaces .........................................
rez = 6

surface = s3d.PolarSurface(rez, basetype='hex_c', minrad=0.4)
surface.map_cmap_from_op( lambda rtz: rtz[0] , cmap='viridis_r' )
surface.map_geom_from_op( boursurf, returnxyz=True )

# 3. Construct figures, add surface, plot ...........................

fig = plt.figure(figsize=plt.figaspect(1))
minmax = (-1.1,1.1)
fig.text(0.975,0.975, "Bour's Minimal Surface, r>0.4", ha='right', va='top', fontsize='larger', multialignment='right')
ax = plt.axes(projection='3d', aspect='equal')
ax.set(xlim=minmax, ylim=minmax, zlim=minmax )
ax.view_init(azim=-50)
ax.set_axis_off()

ax.add_collection3d(surface.shade(.7))

fig.tight_layout()
plt.show()