
Geometric and Alpha Clipping
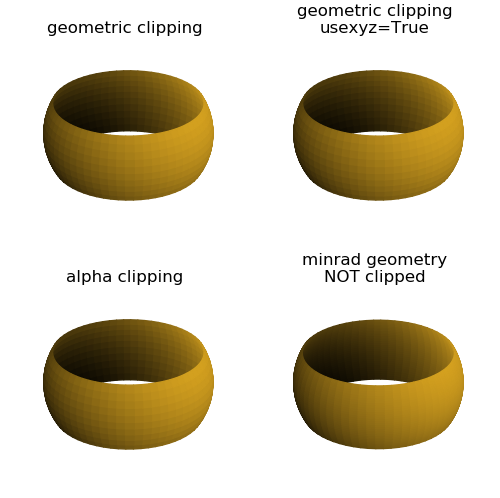
This example demonstrates alternative clipping methods to produce the same visualization.
Two geometric clipped surfaces compare clipping functions which use relative and xyz Cartesian coordinates. For the alpha clipping, a ‘transitional’ color map is used to initially apply a gradient alpha channel in the surface color (highlighted lines).

The R, G, and B color channel values are irrelevant since the clipped surface is followed by applying a color.
A discussion of surface clipping is found in the Contours, Clipped Surfaces and Line Projection and Slices guide.
Clipping was used to create this simple geometry only for demonstration purposes. The geometry could simply be created using the grid basetype of ‘r’ and setting the minrad argument, as in the fourth surface.
import numpy as np
import matplotlib.pyplot as plt
import s3dlib.surface as s3d
import s3dlib.cmap_utilities as cmu

# alpha and geometric clipping
# 1. Define function to examine .....................................
sr = 0.46

def vertGrad(rtp) :
    xyz = s3d.SphericalSurface.coor_convert(rtp,True)
    return np.abs(xyz[2]) > sr

# 2. Setup and map surfaces .........................................
cmu.rgb_cmap_gradient([1,0,0,1],[1,0,0,0],name='red_trans')
surfaces = [None]*4

surfaces[0] = s3d.SphericalSurface.grid(32,64,'r',name='geometric clipping')
surfaces[0].clip(lambda rtp : np.logical_not(vertGrad(rtp)) )

surfaces[1] = s3d.SphericalSurface.grid(32,64,'r',name='geometric clipping\nusexyz=True')
surfaces[1].clip(lambda xyz : np.abs(xyz[2]) < sr, True )

surfaces[2] = s3d.SphericalSurface.grid(32,64,'r',name='alpha clipping')
surfaces[2].map_cmap_from_op( vertGrad, 'red_trans' ).clip_alpha(sr)

mr = (1-sr*sr)**0.5
surfaces[3] = s3d.SphericalSurface.grid(32,64,'r', minrad=mr,name='minrad geometry\nNOT clipped')

# 3. Construct figure, add surface, plot ............................

minmax=(-0.8,0.8)
fig = plt.figure(figsize=(5,5))
for i,surface in enumerate(surfaces) :
    ax = fig.add_subplot(221+i, projection='3d', aspect='equal')
    ax.set(xlim=minmax, ylim=minmax, zlim=minmax )
    ax.set_axis_off()
    ax.set_title(surface.name, pad=-1)

    surface.set_color('goldenrod')
    ax.add_collection3d(surface.shade())

fig.tight_layout(pad=0)
plt.show()