
Complex Number Representation, Hue and Value
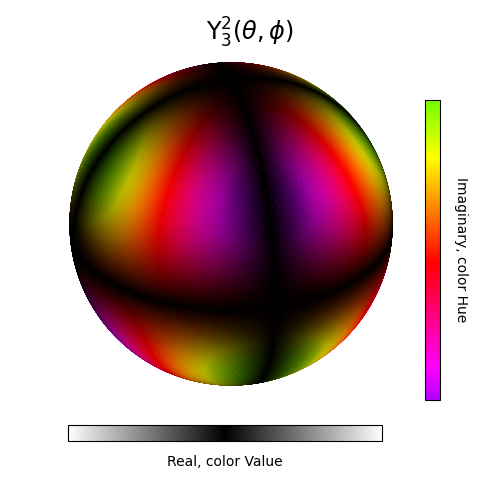
In this example, the spherical harmonic function is used which has both the real and imaginary components. To differentiate these two components, the value and hue of the surface HSV color is used on a spherical surface. Real and imaginary components are the value and hue, respectively.
import numpy as np
from scipy import special as sp
from matplotlib import pyplot as plt
import s3dlib.surface as s3d
import s3dlib.cmap_utilities as cmu

#.. Complex Number Representation, Hue and Value

# 1. Define function to examine .....................................

real = True
imaginary =  not real

def sphHar(rtp, isReal) :
    r, theta, phi = rtp
    m, n = 2,3
    sph = sp.sph_harm(m, n, theta, phi)
    if isReal : r = sph.real
    else :      r = sph.imag
    return r, theta, phi

Hlow, Hhi = 0.783, 1.258  # Hue=[0,2] limits

def hsv_complex(rtp) :
    Z_real = sphHar(rtp,real)[0]
    Z_real = np.abs(Z_real)
    Z_img  = sphHar(rtp,imaginary)[0]
    R = ( Z_real - np.amin(Z_real) )/( np.amax(Z_real) - np.amin(Z_real) )
    I = ( Z_img - np.amin(Z_img) )/( np.amax(Z_img) - np.amin(Z_img) )
    Hrange = Hlow + (Hhi-Hlow)*I  # limit the range of hue in I = [0,1]
    h = np.mod( Hrange, 1.0)
    s = np.ones(len(h))
    v = R
    return h,s,v

# 2. Setup and map surfaces .........................................
rez = 6
purple2green = cmu.hsv_cmap_gradient([Hlow,1,1],[Hhi,1,1])
valmap = cmu.hsv_cmap_gradient([0,0,1],[0,0,0],mirrored=True)

sph_23 = s3d.SphericalSurface(rez, basetype='octa', cmap=purple2green)
sph_23.map_color_from_op( hsv_complex,rgb=False )

# 3. Construct figures, add surface, plot ...........................

info =r'$\Upsilon_{3}^{2}(\theta,\phi)$'
minmax = (-0.8,0.8)
fig = plt.figure(figsize=(5,5))
fig.text(0.5,0.9,info, ha='center', va='bottom', fontsize='xx-large')
ax = plt.axes(projection='3d', aspect='equal')
ax.set(xlim=minmax, ylim=minmax, zlim=minmax )
ax.set_axis_off()

cbar = plt.colorbar(sph_23.cBar_ScalarMappable, ax=ax, ticks=[], shrink=0.6, pad=-.05 )
cbar.set_label('Imaginary, color Hue', rotation=270, labelpad = 20)

sm = plt.cm.ScalarMappable(cmap=valmap)
sm.set_array([])
cbar2 = fig.colorbar(sm, ax=ax, ticks=[], shrink=0.7, pad=-.06, orientation='horizontal' )
cbar2.set_label('Real, color Value', labelpad = 10)

ax.add_collection3d(sph_23.shade(.8))

fig.tight_layout(pad=0)
plt.show()