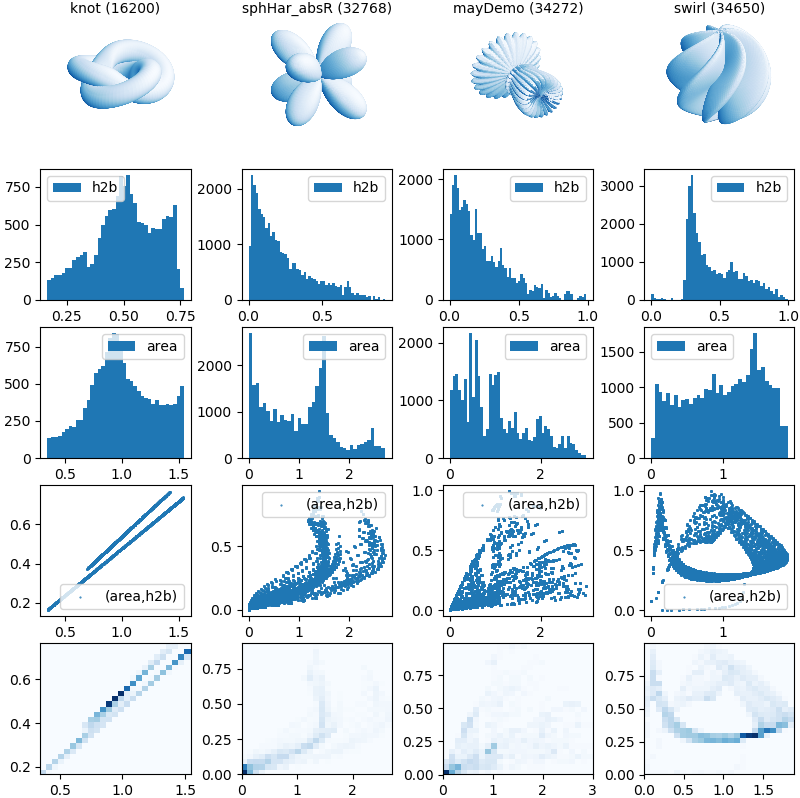
Surface Face Distributions

The surface property, area_h2b, is a 2 X N array of areas and height to width ratios of the N polygonal surface faces. Areas are normalized with respect to the average face area. The height to width ratios are normalized so that equilateral triangles and squares have a value of unity. These example surfaces show the various distributions which are dependent on the geometric mapping and original base geometries which are mapped.
import numpy as np
import matplotlib.pyplot as plt
import s3dlib.surface as s3d
from scipy import special as sp

#.. Face distribution characteristics

# 1. Define functions to examine ....................................
def knot(rtz) :
    r,t,z = rtz
    rho,zeta,delta,scale = 0.25, 0.25, 0.3, 1.9
    R = (1-rho)*(1-delta*np.sin(3*t)) + rho*np.cos(z*np.pi)
    Z = rho*np.sin(z*np.pi) + zeta*np.cos(3*t)
    return scale*R, 2*t, scale*Z

def sphHar_absR(rtp) :
    def sphHar(rtp) :
        r, theta, phi = rtp
        m, l = 2,3
        r = sp.sph_harm(m, l, theta, phi).real
        return r, theta, phi
    r, theta, phi = sphHar(rtp)
    return np.abs(r), theta, phi

def mayDemo(rtp) :
    r,theta,phi = rtp
    m0 = 4; m1 = 3; m2 = 2; m3 = 3; m4 = 6; m5 = 2; m6 = 6; m7 = 4
    R = np.sin(m0*phi)**m1 + np.cos(m2*phi)**m3 + np.sin(m4*theta)**m5 + np.cos(m6*theta)**m7
    x = R*np.sin(phi)*np.cos(theta)
    y = R*np.cos(phi)
    z = R*np.sin(phi)*np.sin(theta)
    return [x,y,z]

def swirl(rtp) :
    r,t,p = rtp
    u,v = t,p
    R = 2 + np.sin(7*u + 5*v)
    return R,t,p

# 2. Setup and map surfaces .........................................
surfaces = []

surface = s3d.CylindricalSurface.grid(90,180,'r')
surface.map_geom_from_op(knot)
surfaces.append(surface)

surface = s3d.SphericalSurface(6, basetype='octa')
surface.map_geom_from_op(sphHar_absR)
surfaces.append(surface)

surface = s3d.SphericalSurface.grid(5*24,6*24)
surface.map_geom_from_op(mayDemo,True).evert().transform(s3d.eulerRot(-120,-5))
surfaces.append(surface)

surface = s3d.SphericalSurface.grid(5*20,7*25)
surface.map_geom_from_op( swirl )
surfaces.append(surface)

ah2b = [ surf.area_h2b for surf in surfaces]

# 3. Construct figures, add surface, plot ...........................

fig = plt.figure(figsize=(8,8))
nplots,nsurf = 5, len(surfaces)
for i in range(nplots) :
    for j,surface in enumerate(surfaces) :
        k= j+i*nsurf +1
        if i==0 :    #....... surface
            ax = fig.add_subplot(nplots,nsurf,k, projection='3d')
            surface.map_cmap_from_normals('Blues_r')
            title = surface.name+' ('+str(len(surface.fvIndices))+')'
            ax.set_title(title, fontsize='medium')
            ax.set_axis_off()
            ax.set_proj_type('ortho')
            s3d.auto_scale(ax,surface, uscale=0.7 )
            ax.add_collection3d(surface)
        elif i==3 :  #....... (area,h2b) plot
            ax = fig.add_subplot(nplots,nsurf,k)
            ax.scatter(*ah2b[j],s=1,marker='.',label='(area,h2b)')
            ax.legend()
        elif i==4 :  #....... 2D histogram
            ax = fig.add_subplot(nplots,nsurf,k)
            ax.hist2d(*ah2b[j],bins=(25,25),cmap='Blues')
        else :       #....... histograms
            ax = fig.add_subplot(nplots,nsurf,k)
            val = ah2b[j][1] if i==1 else ah2b[j][0]
            label = 'h2b' if i==1 else 'area'
            ax.hist(val,bins='auto',label=label)
            ax.legend()

fig.tight_layout(pad=0)

plt.show()
