Random Face Distributions

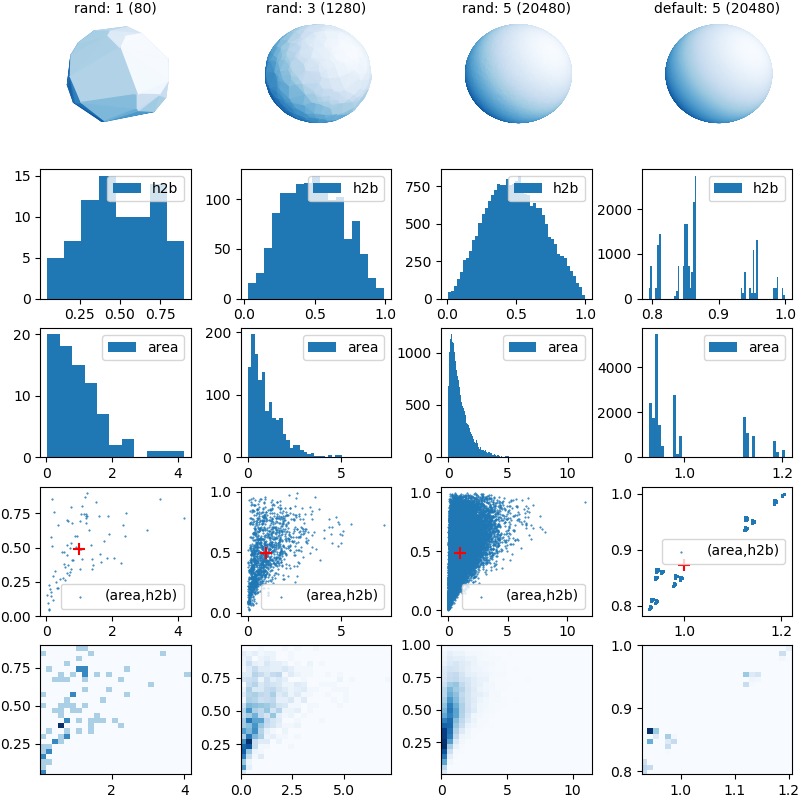
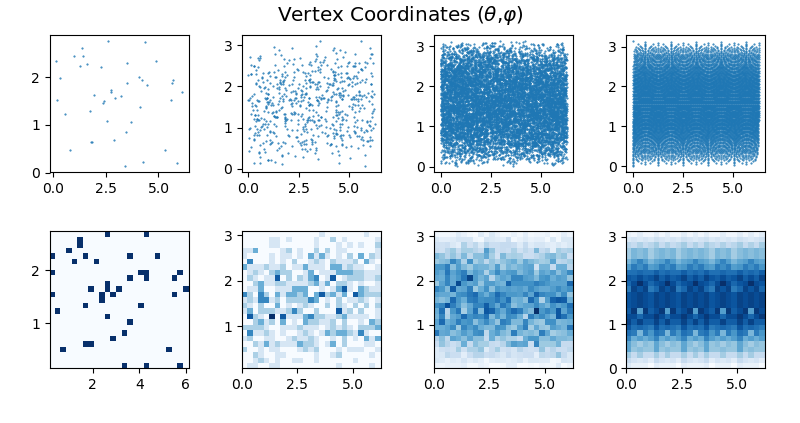
Similar to the Surface Face Distributions example, this figure is for a SphericalSurface base with random triangular faces. The surface, at the right column, is a default SphericalSurface for comparison. Below are (θ , φ) plots for the vertex coordinate distributions.

import numpy as np
import matplotlib.pyplot as plt
import s3dlib.surface as s3d
from scipy import special as sp

#.. Rand Spherical Base distribution characteristics

# 2. Setup and map surfaces .........................................
surfaces = [None]*4
seed = 3

surfaces[0] = s3d.SphericalSurface.rand(1, seed, name='rand: 1' )
surfaces[1] = s3d.SphericalSurface.rand(3, seed, name='rand: 3' )
surfaces[2] = s3d.SphericalSurface.rand(5, seed, name='rand: 5' )
surfaces[3] = s3d.SphericalSurface( 5,           name='default: 5' )

ah2b = [ surf.area_h2b for surf in surfaces]

# 3. Construct figures, add surface, plot ...........................

# Face Distributions ================================================
fig = plt.figure(figsize=(8,8))
nplots,nsurf = 5, len(surfaces)
for i in range(nplots) :
    for j,surface in enumerate(surfaces) :
        k= j+i*nsurf +1
        if i==0 :    #....... surface
            ax = fig.add_subplot(nplots,nsurf,k, projection='3d')
            surface.map_cmap_from_normals('Blues_r')
            title = surface.name+' ('+str(len(surface.fvIndices))+')'
            ax.set_title(title, fontsize='medium')
            ax.set_axis_off()
            ax.set_proj_type('ortho')
            s3d.auto_scale(ax,surface, uscale=0.7 )
            ax.add_collection3d(surface)
        elif i==3 :  #....... (area,h2b) plot
            ax = fig.add_subplot(nplots,nsurf,k)
            ax.scatter(*ah2b[j],s=1,marker='.',label='(area,h2b)')
            ax.legend()
            ax.scatter(*np.mean(ah2b[j],axis=1),s=80,marker='+',c='r')
        elif i==4 :  #....... 2D histogram
            ax = fig.add_subplot(nplots,nsurf,k)
            ax.hist2d(*ah2b[j],bins=(25,25),cmap='Blues')
        else :       #....... histograms
            ax = fig.add_subplot(nplots,nsurf,k)
            val = ah2b[j][1] if i==1 else ah2b[j][0]
            label = 'h2b' if i==1 else 'area'
            ax.hist(val,bins='auto',label=label)
            ax.legend()
fig.tight_layout(pad=0)

# Vertex Coordinates ================================================
fig = plt.figure(figsize=(8,4.25))
fig.text(0.5,0.95,r'Vertex Coordinates ($\theta$,$\varphi$)',
    ha='center',fontsize='x-large')
for i in range(2) :
    for j,surface in enumerate(surfaces) :
        k =  j + 4*i
        ax = fig.add_subplot(241+k)
        title = surface.name+' ('+str(len(surface.fvIndices))+')'
        rs,ts,ps = s3d.SphericalSurface.coor_convert(surface.vertices)
        x,y = ts,ps
        if i==0 :
            ax.scatter(x,y,s=0.25)
        else :
            ax.hist2d(x,y,bins=(25,25),cmap='Blues')
fig.tight_layout(pad=2.25)

# ===================================================================
plt.show()
