Hello World Example
The function description is from the Image demo Matplotlib example.
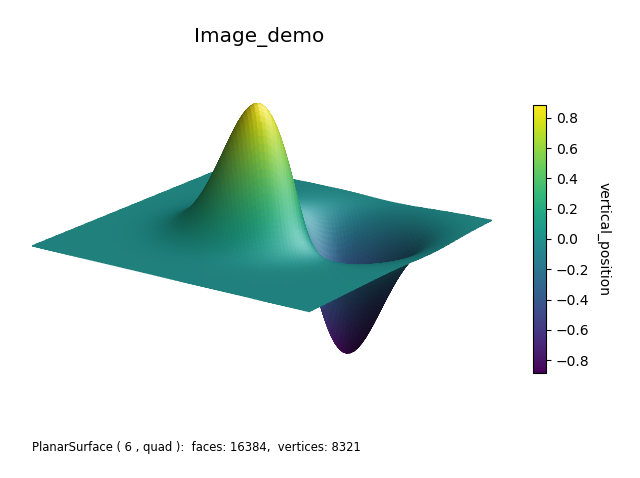
This example demonstrates the basics of setting object resolution (rez), functional geometric mapping, surface color mapping, shading, highlighting, creating a color bar, string representation of a surface object, setting axis limits, axes view orientation, and finally, adding the surface object to the 3D viewing axis. Also, defaults are used for the surface object name, color value name and the colormap.
 1 import numpy as np
 2 from matplotlib import pyplot as plt
 3 import s3dlib.surface as s3d
 4
 5 #.. Hello World Example
 6
 7 # 1. Define function to examine .....................................
 8
 9 def Image_demo(xyz) : # ..... for surface geometry
10     x,y,z = xyz
11     X,Y = 3*x, 3*y
12     Z1 = np.exp(-X**2 - Y**2)
13     Z2 = np.exp(-(X - 1)**2 - (Y - 1)**2)
14     Z = Z1-Z2
15     return x,y,Z
16
17 def vertical_position(xyz) : # ..... for colormapping
18     x,y,z = xyz
19     return z
20
21 # 2. Setup and map surfaces .........................................
22 rez = 6
23
24 surface = s3d.PlanarSurface(rez)
25 surface.map_geom_from_op( Image_demo )
26 surface.map_cmap_from_op( vertical_position )
27 surface.shade().hilite(.5)
28
29 # 3. Construct figure, add surface, plot ............................
30
31 fig = plt.figure(figsize=plt.figaspect(0.75))
32 ax = plt.axes(projection='3d', aspect='equal')
33 ax.set(xlim=( -0.8,0.8 ), ylim=( -0.8,0.8 ), zlim=( -0.8,0.8 ) )
34 ax.set_axis_off()
35 ax.view_init(20,-55)
36
37 fig.text(0.05,0.05,str(surface), ha='left', va='bottom', fontsize='smaller')
38 ax.set_title(surface.name, fontsize='x-large')
39 cbar = plt.colorbar(surface.cBar_ScalarMappable, ax=ax,  shrink=0.6 )
40 cbar.set_label(surface.cname, rotation=270, labelpad = 15)
41
42 ax.add_collection3d(surface)
43
44 fig.tight_layout()
45 plt.show()
object information
A string representation of the surface object using Python str provides the object class, rez and basetype. The number of vertices and faces are also included. In this example, the figure text at the lower left of the figure shows this object’s information. See line 37.
The coordinate limits for the object may be determined from the object dictionary property bounds. The key,value pairs of this dictionary are given in the Surface3DCollection API to the geometry properties.
The bounds object property may be useful for setting the Matplotlib axis limits. For example in this case, line 33 may be replaced by:
ax.set(xlim=0.8*surface.bounds['xlim'],
       ylim=0.8*surface.bounds['ylim'],
       zlim=0.8*surface.bounds['zlim'] )
For this figure, the factor 0.8 was used to enlarge the surface in the axes view.
object name
The surface name identifier is assigned, by default, to the geometry mapping function name. In this example case, Image_demo. Alternatively, the identifier can be directly assigned in the object constructor, line 24, as:
surface = s3d.PlanarSurface(rez, name='Image_demo' )
or using the geometry mapping method argument, line 25 , as:
surface.map_geom_from_op( Image_demo, name='Image_demo' )
In this example, the object name property is used in the axis title on line 38.
color operation
This example uses colormapping in the z-direction. The simple vertical_position function was defined to demonstrate the use of the function name for the colorbar label on line 40. Alternatively, lambda functions could be used instead on line 26. Using the surface geometry, line 26 could be written as:
surface.map_cmap_from_op( lambda c: c[2] , cname='vertical_position' )
Or, using the z coordinate directly from the function, this line can be replaced by:
surface.map_cmap_from_op( lambda c: Image_demo(c)[2] , cname='vertical_position' )
Both approaches will produce identical results. The second approach can be used prior to geometric mapping. The colormapping identifier, cname, is now explicitly assigned by the method argument and can be used for the colorbar label.
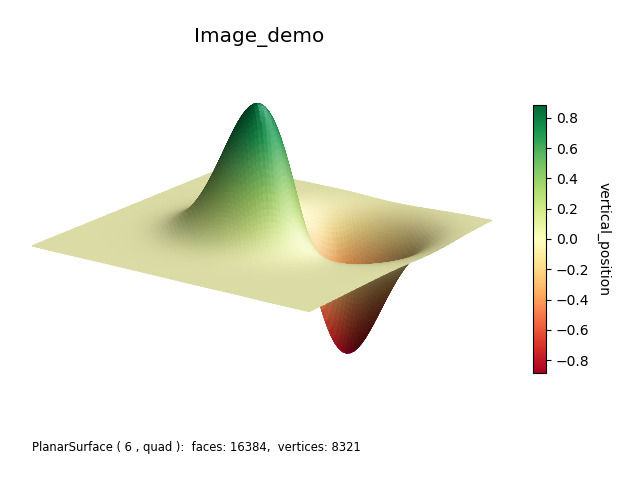
colormap
The default colormap is used for this figure, which is viridis. The Matplotlib example uses a RdYlGn colormap. To use this colormap instead of the default, change the default colormap on line 24 of the surface constructor as:
surface = s3d.PlanarSurface(rez,cmap='RdYlGn')
or set the colormap used for mapping on line 26 as:
surface.map_cmap_from_op( vertical_position, 'RdYlGn' )
Both approaches will produce the following:
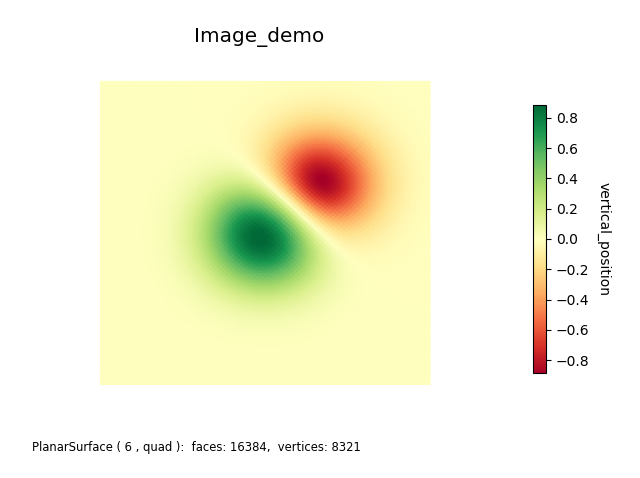
2D ‘image’ plot
When the surface is viewed from the top using:
ax.view_init(90,-90)
instead of line 35, and removing line 27 for shading and highlighting, the view is similar to the Matplotlib image demo.