
Hello World Grid Example
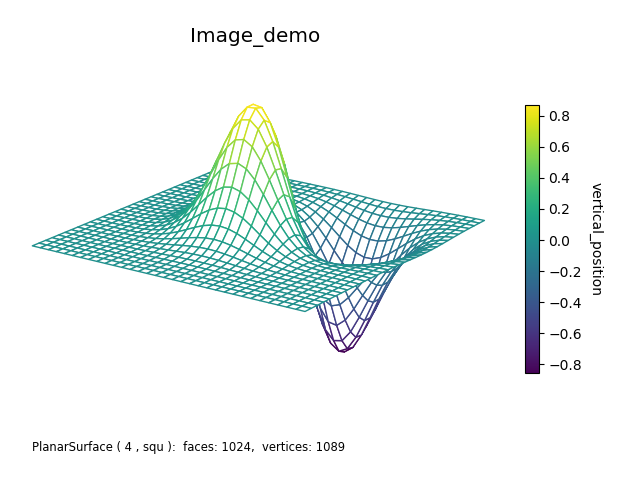
This example is similar to the Hello World Example example. The only changes are using a ‘squ’ basetype with a lower rez, setting the facecolor white, and not shading or highlighting (highlighted lines). Note that the edgecolor retains the surface color mapping even after the facecolor is set to white.
import numpy as np
from matplotlib import pyplot as plt
import s3dlib.surface as s3d

#.. Hello World Example

# 1. Define function to examine .....................................

def Image_demo(xyz) : # ..... for surface geometry
    x,y,z = xyz
    X,Y = 3*x, 3*y
    Z1 = np.exp(-X**2 - Y**2)
    Z2 = np.exp(-(X - 1)**2 - (Y - 1)**2)
    Z = Z1-Z2
    return x,y,Z

def vertical_position(xyz) : # ..... for colormapping
    x,y,z = xyz
    return z

# 2. Setup and map surfaces .........................................
rez = 4

surface = s3d.PlanarSurface(rez,'squ')
surface.map_geom_from_op( Image_demo )
surface.map_cmap_from_op( vertical_position )
surface.set_facecolor([1,1,1])

# 3. Construct figure, add surface, plot ............................

fig = plt.figure(figsize=plt.figaspect(0.75))
ax = plt.axes(projection='3d', aspect='equal')
ax.set(xlim=( -0.8,0.8 ), ylim=( -0.8,0.8 ), zlim=( -0.8,0.8 ) )
ax.set_axis_off()
ax.view_init(20,-55)

fig.text(0.05,0.05,str(surface), ha='left', va='bottom', fontsize='smaller')
ax.set_title(surface.name, fontsize='x-large')
cbar = plt.colorbar(surface.cBar_ScalarMappable, ax=ax,  shrink=0.6 )
cbar.set_label(surface.cname, rotation=270, labelpad = 15)

ax.add_collection3d(surface)

fig.tight_layout()
plt.show()