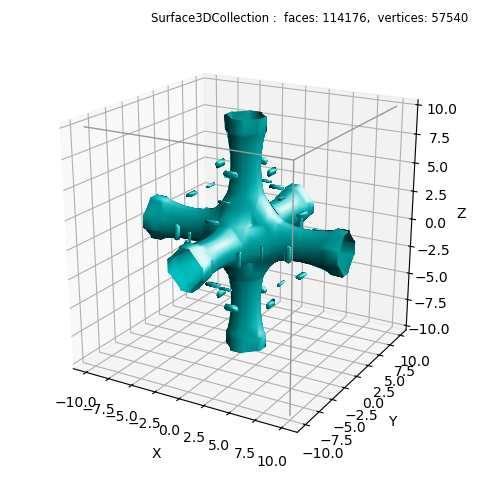
Iso Surface

This example shows the surface for a specific value within the domain, assigning the argument fval to a value. The formula was found at Mayavi demo examples Visualizing volumetric scalar data .
import numpy as np
import matplotlib.pyplot as plt
import s3dlib.surface as s3d

# 1. Define function to examine .....................................

def mfunc(xyz) :
    x,y,z = xyz
    return np.sin(x*y*z)/(x*y*z)

# 2. Setup and map surface .........................................

surface = s3d.Surface3DCollection.implsurf(mfunc, 1.9, 10, fval=0.1, color='c').evert()
surface.triangulate(3)

# 3. Construct figure, add surface, and plot ......................

fig = plt.figure(figsize=plt.figaspect(1))
fig.text(0.975,0.975,str(surface), ha='right', va='top', fontsize='smaller')
ax = plt.axes(projection='3d', aspect='equal', focal_length=0.5)
ax.set(xlabel='X',ylabel='Y',zlabel='Z')
ax.view_init(20)
s3d.auto_scale(ax,surface)
surface.shade(0.0,ax=ax,flat=False).hilite(.9,focus=1,flat=False)
ax.add_collection3d(surface)

#  front edge lines, coordinates/indices
vE = [ [-10,-10,10], [10,-10,10], [10,10,10], [10,-10,-10] ]
iE = [ [0,1,2],[1,3]]
ax.add_collection3d( s3d.ColorLine3DCollection(vE,iE,color='0.6',lw=1) )

fig.tight_layout(pad=2)
plt.show()
