
RGB Planes
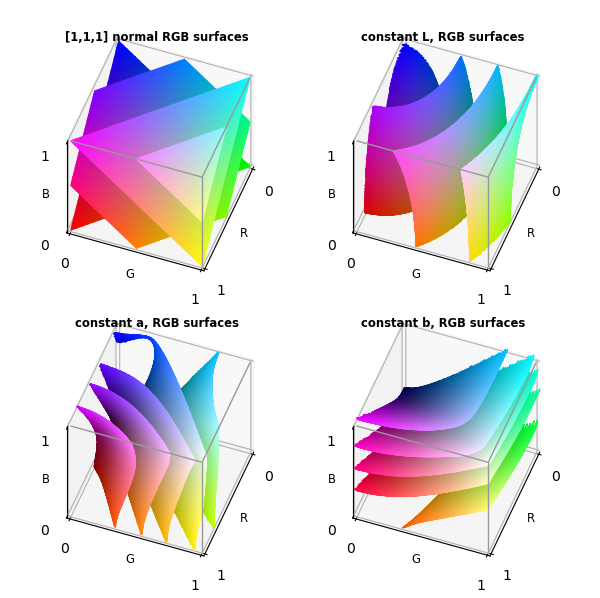
Compared to the Lab Planes example, for this case flat planes in Lab space are mapped to RGB space, then geometrically clipped.
REOM: 2
import copy
import numpy as np
from matplotlib import pyplot as plt
import matplotlib.colors as colors
import s3dlib.surface as s3d
from colorspacious import cspace_converter

#.. RGB, HSV & Lab planes in Lab Color Space

# 1. Define function to examine ....................................
def rgb_to_labCoor(rgb):  # X, Y, Z
    L,a,b = cspace_converter("sRGB1", "CAM02-UCS"  )(rgb.T).T
    return a,b,L

def Lab_to_rgbCoor(abL) :
    a,b,L = abL
    Lab = np.array([L,a,b])
    rgb = cspace_converter( "CAM02-UCS", "sRGB1" )(Lab.T).T
    return rgb

def RGB_box(xyz):
    x,y,z = xyz
    inboundX = np.logical_and(x>0, x<1)
    inboundY = np.logical_and(y>0, y<1)
    inboundZ = np.logical_and(z>0, z<1)
    return inboundX*inboundY*inboundZ


# 2. Setup and map surface .........................................
rez = 5

v = [ [0.5,1,1], [1,0.5,1], [1,1,0.5] ,
      [0,1,1], [1,0,1], [1,1,0] ,
      [0,0,1], [1,0,0], [0,1,0] ,
      [0,0,0.5], [0.5,0,0], [0,0.5,0] ,
      [0,0.5,1], [0.5,0,1], [1,0,0.5],     [1,0.5,0], [0.5,1,0], [0,1,0.5]  ]
f = [ [0,1,2], [3,4,5], [6,7,8], [9,10,11] ,   [12,13,14,15,16,17] ]

rgb_planes = s3d.Surface3DCollection(v,f).triangulate(rez)
rgb_planes.map_color_from_op(lambda xyz : xyz)
rgb_planes.name = '[1,1,1] normal RGB surfaces'

# Following to determine domain of Lab a & b --------------------------
surface = s3d.CubicSurface(3).domain([0,1],[0,1],[0,1])
surface.map_geom_from_op(rgb_to_labCoor)
admn,bdmn,ldmn = surface.bounds['xlim'], surface.bounds['ylim'], [0,100]
# ---------------------------------------------------------------------

L_planes = None
for i in range(5) :
    L = 10 + 20*i
    plane = s3d.PlanarSurface(rez+3,'oct1').domain(admn,bdmn,L)
    plane.map_geom_from_op(Lab_to_rgbCoor)
    plane.clip(RGB_box)
    plane.map_color_from_op(lambda c : c)
    if L_planes is None : L_planes = plane
    else:                 L_planes += plane
L_planes.name= 'constant L, RGB surfaces'

a_planes = None
temp = np.linspace(*admn,7)
aVals = temp[1:len(temp)-1]
for a in aVals :
    plane = s3d.PlanarSurface(rez+2,'oct1').domain(bdmn,[0,100],a)
    plane.transform(s3d.eulerRot( 90,90 ))
    plane.map_geom_from_op(Lab_to_rgbCoor)
    plane.clip(RGB_box)
    plane.map_color_from_op(lambda c : c)
    if a_planes is None : a_planes = plane
    else:                 a_planes += plane
a_planes.name= 'constant a, RGB surfaces'

b_planes = None
temp = np.linspace(*bdmn,7)
bVals = temp[1:len(temp)-1]
for b in bVals :
    plane = s3d.PlanarSurface(rez+2,'oct1').domain(admn,[0,100],b)
    plane.transform(s3d.eulerRot( 0,90 ))
    plane.map_geom_from_op(Lab_to_rgbCoor)
    plane.clip(RGB_box)
    plane.map_color_from_op(lambda c : c)
    if b_planes is None : b_planes = plane
    else:                 b_planes += plane
b_planes.name = 'constant b, RGB surfaces'

vE = [ [1,0,1], [1,1,1], [0,1,1], [1,1,0] ]
iE = [ [0,1,2],[1,3]]
rgb_edge= s3d.ColorLine3DCollection(vE,iE,color='0.6',lw=1)

surfaces = [ rgb_planes, L_planes, a_planes, b_planes]

# 3. Construct figure, add surface plot ............................

fig = plt.figure(figsize=(6,6))
minmax= [0,1]
for i,surface in enumerate(surfaces) :
    ax = fig.add_subplot(221+i, projection='3d')
    ax.set(xlim=minmax, ylim=minmax, zlim=minmax)
    ax.set_xticks(minmax)
    ax.set_yticks(minmax)
    ax.set_zticks(minmax)
    ax.set_xlabel('R', fontsize='small', labelpad=-10)
    ax.set_ylabel('G', fontsize='small', labelpad=-10)
    ax.set_zlabel('B', fontsize='small', labelpad=-10)
    ax.set_title( surface.name, fontsize='small', fontweight='bold' )
    ax.set_proj_type('ortho')
    ax.view_init(50,20)

    ax.add_collection3d( surface )
    ax.add_collection3d( copy.copy(rgb_edge) )

fig.tight_layout(pad=2)
plt.show()