
Lab Planes
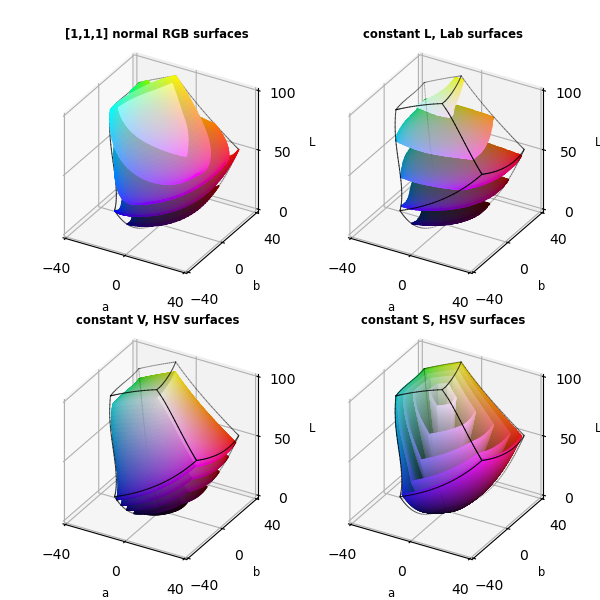
This demonstrates using various base surfaces (highlighted) to construct planes in an alternative 3D space. RGB and HSV color boundaries are conveniently defined using Planar, Polar and Cylindrical geometries, then mapped to Lab space. Bounds for Lab color planes are visualized by clipping Lab colors not in the RGB domain.
import copy
import numpy as np
from matplotlib import pyplot as plt
import matplotlib.colors as colors
import s3dlib.surface as s3d
from colorspacious import cspace_converter

#.. RGB, HSV & Lab planes in Lab Color Space

# 1. Define function to examine ....................................

def rgb_to_labCoor(rgb):  # X, Y, Z
    L,a,b = cspace_converter("sRGB1", "CAM02-UCS"  )(rgb.T).T
    return a,b,L

def rtz_to_labCoor(rtz):
    hsv = np.array(  hsvColor(rtz)  )
    rgb = np.array(colors.hsv_to_rgb(hsv.T)).T
    return rgb_to_labCoor(rgb)

def hsvColor(rtz) :
    r,t,z = rtz
    return [t/(2*np.pi), r, z]  # all values are in [0,1]

def labColor(abl) :  # 40*X,40*Y, zlim*Z
    a,b,L = abl
    Lab = np.array([L,a,b])
    rgb = cspace_converter( "CAM02-UCS", "sRGB1" )(Lab.T).T
    # check rgb limits and set transparency....
    rgbRng = np.clip(rgb,0,0.99)
    test = np.linalg.norm(rgb-rgbRng,axis=0)**0.25
    r,g,b = rgb
    ones = np.ones(len(r))
    zeros = np.zeros(len(r))
    errArr = np.full(len(r),test)
    alpha = np.where( errArr > zeros , zeros, ones)
    return r,g,b,alpha

# 2. Setup and map surface .........................................
rez = 5

v = [ [0.5,1,1], [1,0.5,1], [1,1,0.5] ,
      [0,1,1], [1,0,1], [1,1,0] ,
      [0,0,1], [1,0,0], [0,1,0] ,
      [0,0,0.5], [0.5,0,0], [0,0.5,0] ,
      [0,0.5,1], [0.5,0,1], [1,0,0.5],     [1,0.5,0], [0.5,1,0], [0,1,0.5]  ]
f = [ [0,1,2], [3,4,5], [6,7,8], [9,10,11] ,   [12,13,14,15,16,17] ]

rgb_planes = s3d.Surface3DCollection(v,f).triangulate(rez)
rgb_planes.map_color_from_op(lambda xyz : xyz)
rgb_planes.map_geom_from_op(rgb_to_labCoor).shade(.95)
rgb_planes.name = '[1,1,1] normal RGB surfaces'

v_planes = None
for i in range(5) :
    plane = s3d.PolarSurface(rez,'hex').domain(zcoor=0.1+0.2*i)
    plane.map_color_from_op(hsvColor,rgb=False)
    plane.map_geom_from_op(rtz_to_labCoor,returnxyz=True)
    if v_planes is None : v_planes = plane
    else:                 v_planes += plane
v_planes.shade(.5)
v_planes.name= 'constant V, HSV surfaces'

s_planes = None
for i in range(5) :
    plane = s3d.CylindricalSurface(rez).domain(0.1+0.2*i,[0,1] )
    plane.map_color_from_op(hsvColor,rgb=False)
    plane.map_geom_from_op(rtz_to_labCoor,returnxyz=True)
    if s_planes is None : s_planes = plane
    else:                 s_planes += plane
s_planes.shade(.75)
s_planes.name= 'constant S, HSV surfaces'

lab_planes = None
for i in range(5) :
    plane = s3d.PlanarSurface(rez+1,'oct1').domain(40,40,zcoor=15+20*i)
    plane.map_color_from_op( labColor )
    plane.clip_alpha(0.1)
    if lab_planes is None : lab_planes = plane
    else:                   lab_planes += plane
lab_planes.shade(.75)
lab_planes.name= 'constant L, Lab surfaces'

#/ ........
lab_edge = s3d.CubicSurface(lw=1).domain([0,1],[0,1],[0,1]).edges.shred(rez)
lab_edge.set_color('k')
lab_edge.set_linewidth(0.75)
lab_edge.map_geom_from_op(rgb_to_labCoor).fade()

surfaces = [ rgb_planes, lab_planes, v_planes, s_planes ]

# 3. Construct figure, add surface plot ............................

fig = plt.figure(figsize=(6,6))
for i,surface in enumerate(surfaces) :
    ax = fig.add_subplot(221+i, projection='3d', aspect='equal')
    ax.set(xlim=(-40,40), ylim=(-40,40), zlim=(0,100))
    ax.set_xticks([-40,0,40])
    ax.set_yticks([-40,0,40])
    ax.set_zticks([0,50,100])
    ax.set_xlabel('a', fontsize='small')
    ax.set_ylabel('b', fontsize='small')
    ax.set_zlabel('L', fontsize='small')
    ax.set_title( surface.name, fontsize='small', fontweight='bold' )
    ax.set_proj_type('ortho')

    ax.add_collection3d( surface )
    ax.add_collection3d( copy.copy(lab_edge) )

fig.tight_layout(pad=2)
plt.show()