
S3Dlib
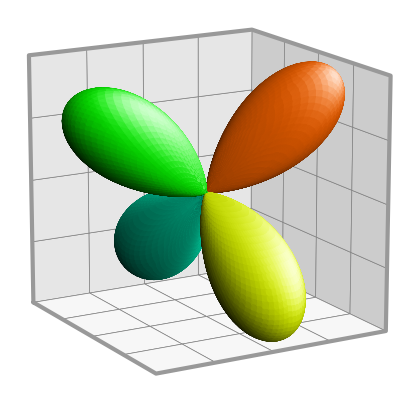
The figure is a clipped surface using the spherical harmonics function used in the Two methods of Representing example. The following is the colormap applied to the surface.

import numpy as np
from scipy import special as sp
from matplotlib import pyplot as plt
import s3dlib.surface as s3d
import s3dlib.cmap_utilities as cmu

#.. S3Dlib logo

# 1. Define function to examine .....................................
v = [ [ 1,-1,-1], [ 1, 1,-1], [-1, 1,-1],
      [-1, 1, 1], [-1,-1, 1], [ 1,-1, 1], [ 1,-1,-1] ]

def sphHar(rtp) :
    r, theta, phi = rtp
    m, l = 2,3
    r = sp.sph_harm(m, l, theta, phi).real
    return r, theta, phi

def sphHar_absR(rtp) :
    r, theta, phi = sphHar(rtp)
    return np.abs(r), theta, phi

# 2. Setup and map surface .........................................
colors = [ [0.03,1,0], [0.90,1,0], [1,0.40,0], [0,1,0.77] ]
cmu.stitch_color(*colors,name='gyoc')

rez, illum, scale = 6, [-2,3,3], 3.6
clip_pos = lambda c : sphHar(c)[0] > 0
fourValue_op = lambda c : [ int(2*t/np.pi+0.5)%4 for t in c[1] ]
sph_23_pos = s3d.SphericalSurface(rez,'octa')
sph_23_pos.map_geom_from_op(sphHar_absR).clip(clip_pos)
sph_23_pos.map_cmap_from_op(fourValue_op, 'gyoc' )
sph_23_pos.transform(scale=scale)
logo = sph_23_pos.shade(direction=illum).hilite(.8,direction=illum)

rez,lw,ec = 1, 0.5, '0.5'
X_plane = lambda c : [ c[1],c[2],c[0] ]
Y_plane = lambda c : [ c[2],c[0],c[1] ]
pl_x = s3d.PlanarSurface(rez,'squ',facecolor='0.8',lw=lw)
pl_x.map_geom_from_op(Y_plane).transform(translate=[-1,0,0])
pl_y = s3d.PlanarSurface(rez,'squ',facecolor='0.9',lw=lw)
pl_y.map_geom_from_op(X_plane).transform(translate=[0,-1,0])
pl_z = s3d.PlanarSurface(rez,'squ',facecolor='0.97',lw=lw)
pl_z.transform(translate=[0,0,-1])
planes = [pl_x,pl_y,pl_z]

brdr = s3d.SegmentLine(v,color='0.6',lw=3)
# 3. Construct figure, add surface, and plot ......................
minmax = (-1,1)
fig = plt.figure(figsize=(4,4))
ax = plt.axes(projection='3d', aspect='equal')
ax.set(xlim=minmax, ylim=minmax, zlim=minmax )
ax.set_axis_off()
ax.view_init(15,60)

for plane in planes :
    plane._sort_zpos = -99
    plane.set_edgecolor(ec)
    ax.add_collection3d(plane)
ax.add_collection3d(logo)
ax.add_collection3d(brdr)

fig.tight_layout(pad=-1)

plt.show()