
Shaded Mobius Strip Visualization
Since a Mobius strip is non-orientable, there is a discontinuity of the face normals as discussed in the non-orientable guide section. For strips with an odd number of twists, a split base surface was required to construct the Cylindrical Coordinates examples to accommodate these non-orientable surfaces. In addition, a mirrored colormap was used to ‘simulate’ shading. This map was needed since surface normals are used for shading, which for this case, would be discontinuous.
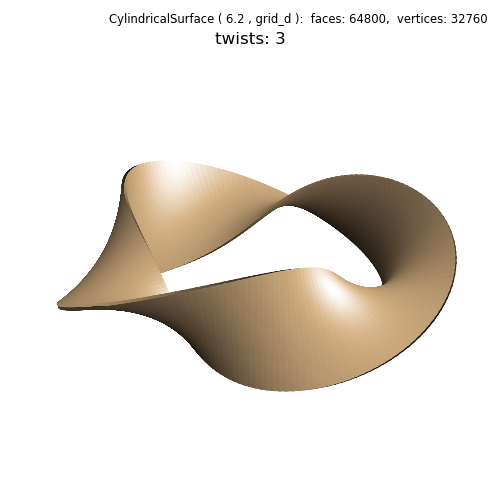
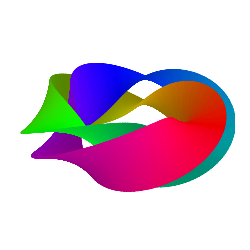
In this example, the function used in the Cylindrical Coordinates example was modified by extending the the angle upper domain from 2π to 4π with shifts in the radial and vertical positions dependent on the angle. As a result, the surface is orientable and a split base surface was not needed, so not used. By keeping the shift small, the surface ‘looks’ non-orientable in the visualization. Using a larger shift, the actual orientable geometry is apparent, as shown below:
Since the surface is orientable, shading and highlighting may be applied for a realistic visualization (highlighted line in the code below). This technique of using a orientable double cover which is shown in the animation for a Mobius Strip ( twistFunction for twist = 1 ).
import numpy as np
from matplotlib import pyplot as plt
import s3dlib.surface as s3d

#.. Expand domain to create orientable 'mobius' surface

# 1. Define functions to examine ....................................

def twistFunction(rtz,twists,ofst) :  # valid only for odd twists
    r,t,z = rtz
    T = 2*t                           # expand domain 0 < T < 4pi
    thickness = 0.33
    w = thickness*z
    phi = 0.5*T*twists                # note use of T, not t
    R = 1 + w * np.cos(phi)
    Z = w * np.sin(phi)
    R += -ofst*np.sin(phi)
    Z +=  ofst*np.cos(phi)
    return R,T,Z

# FIGURE 1:  2 & 3. Setup surfaces and plot ........................

twist = s3d.CylindricalSurface.grid(90,360, color='burlywood')
twist.map_geom_from_op( lambda rtz : twistFunction(rtz,3,0.01) )
twist.evert()

fig = plt.figure(figsize=(5,5))
fig.text(0.975,0.975,str(twist), ha='right', va='top',
        fontsize='smaller', multialignment='right')
ax = plt.axes(projection='3d', aspect='equal')
ax.view_init(25)
ax.set(xlim=(-0.8,0.8), ylim=(-0.8,0.8), zlim=(-0.7,0.7) )
ax.set_title('\ntwists: 3')
ax.set_axis_off()

ax.add_collection3d(twist.shade().hilite(1,None,2))

fig.tight_layout()

# FIGURE 2:  2 & 3. Setup surfaces and plot ........................

twist = s3d.CylindricalSurface.grid(90,360)
twist.map_cmap_from_op( lambda c : c[1], 'hsv')
twist.map_geom_from_op( lambda rtz : twistFunction(rtz,3,0.15) )
twist.evert()

fig = plt.figure(figsize=(2.5,2.5))
ax = plt.axes(projection='3d', aspect='equal')
ax.view_init(25)
ax.set(xlim=(-0.8,0.8), ylim=(-0.8,0.8), zlim=(-0.7,0.7) )
ax.set_axis_off()

ax.add_collection3d(twist.shade(.5))

fig.tight_layout()

plt.show()