Functional RGB Color Mapping
This example is based on the Matplotlib function used in the RGB volumetric plot example. RGB space is more clearly illustrated in the Color Space example and the RGB Mapping animation.
import numpy as np
import matplotlib.pyplot as plt
import s3dlib.surface as s3d
#.. Functional RGB and CMY Color Mapping
# 1. Define functions to examine ....................................
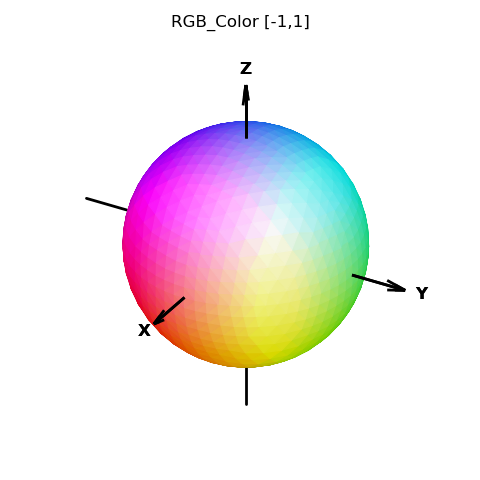
def RGB_Color(rtp) :
x,y,z = s3d.SphericalSurface.coor_convert( rtp, tocart=True )
# now, map xyz from [-1,1] to RGB space in [0,1]
R = ( x + 1 ) /2.0
G = ( y + 1 ) /2.0
B = ( z + 1 ) /2.0
return R,G,B # all values are in [0,1]
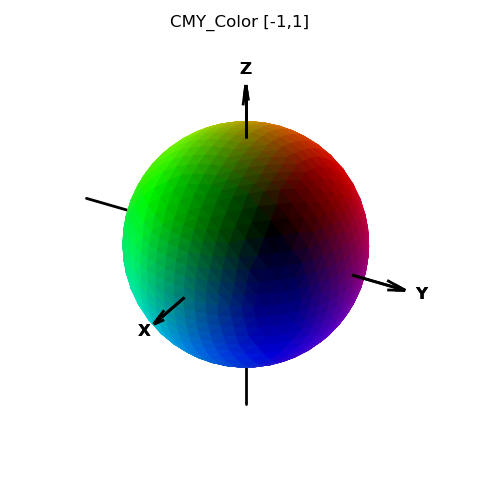
def CMY_Color(rtp) :
return 1 - np.array(RGB_Color(rtp))
# 2. Setup and map surfaces .........................................
rez = 4
expand = np.sqrt(3)
surface = s3d.SphericalSurface(rez, basetype='octa')
surface.transform(scale=expand) # expand radius to RGB corners.
surface.map_color_from_op(RGB_Color)
#surface.map_color_from_op(CMY_Color)
surface.transform(scale=1/expand) # contract back to [-1,1]
# 3. Construct figure, add surfaces, and plot ......................
fig = plt.figure(figsize=plt.figaspect(1))
ax = plt.axes(projection='3d', aspect='equal')
ax.set(xlim=(-1,1), ylim=(-1,1), zlim=(-1,1))
ax.set_title( surface.cname + ' [-1,1]')
s3d.standardAxis(ax, offset=1.0)
s3d.standardAxis(ax, offset=1.0, negaxis=True, alr=0.35)
ax.add_collection3d(surface.shade(.7))
fig.tight_layout()
plt.show()
Note
Once transformed from rtp coordinates, the color is simply a result of using the XYZ coordinates in RGB space. Since the sphere is initially expanded, the RGB colors are clipped to the range [0,1].
To view the sphere in CMY color space, switch the commented lines which are highlighted in the above script, with the result: