
Imaginary Earth
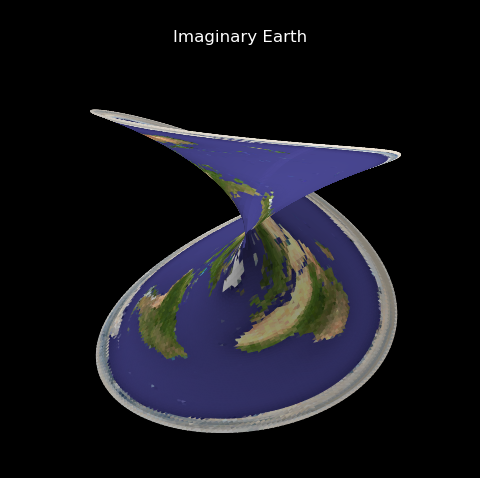
This is just a simple example of image mapping, then geometric mapping. The geometry map uses the function from Complex Number Representation, Geometry and Colormap example. Note that a polar image projection is applied to the polar surface prior to the geometric mapping.
import numpy as np
import matplotlib.pyplot as plt
import s3dlib.surface as s3d

#.. Imaginary Earth

# 1. Define functions to examine ....................................

real = True
imaginary =  not real

def sqrt_Z(rtz, isReal) :
    r,t,z = rtz
    T=2*t
    if isReal :  Z = np.sqrt(r)*np.cos(T/2)
    else :       Z = np.sqrt(r)*np.sin(T/2)
    return r,T,Z

# 2. Setup and map surfaces .........................................

surface_1 = s3d.PolarSurface(6)
surface_1.map_color_from_image("data/earth.png")
surface_1.transform(s3d.eulerRot(115,0))
surface_1.map_geom_from_op( lambda rtz : sqrt_Z(rtz,imaginary) ).shade(.2,direction=[1,1,1])

# 3. Construct figure, add surfaces, and plot .....................

minmax = (-.8,.8)
fig = plt.figure(figsize=plt.figaspect(1), facecolor='k')
ax1 = fig.add_subplot(111, projection='3d', aspect='equal', facecolor='k')
ax1.view_init(20, 205)
ax1.set(xlim=minmax, ylim=minmax, zlim=minmax)
ax1.set_title('Imaginary Earth',color='w')
ax1.set_axis_off()

ax1.add_collection3d(surface_1)

fig.tight_layout()
plt.show()
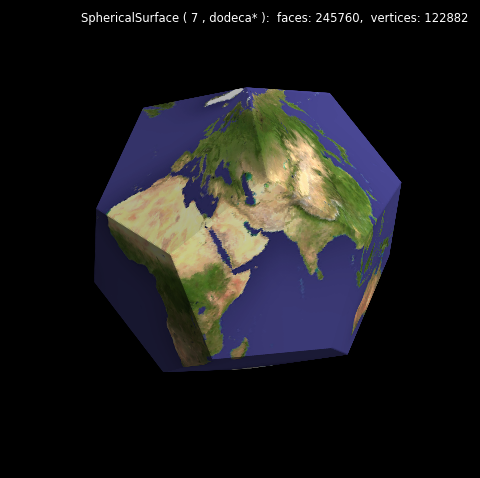
The above is just another simple example of image mapping. In this case, a spherical image projection is made onto multiple flat surfaces. This projection results in minor distortions on the flat surfaces.
import numpy as np
from matplotlib import pyplot as plt
import s3dlib.surface as s3d

#.. Spherical Image Mapping onto a Dodecahedron

# 1. Define functions to examine ....................................
# 2. Setup and map surfaces .........................................
rez=7

surface = s3d.SphericalSurface.platonic(rez,'dodeca')
surface.map_color_from_image('data/earth.png')
surface.transform( s3d.eulerRot(70,0) )

# 3. Construct figure, add surfaces, and plot ......................

fig = plt.figure(figsize=plt.figaspect(1) )
fig.text(0.975,0.975,str(surface), ha='right', va='top',
    color='w', fontsize='smaller', multialignment='right')
ax = plt.axes(projection='3d', facecolor='k', aspect='equal')
minmax = (-0.8,0.8)
ax.set(xlim=minmax, ylim=minmax, zlim=minmax)
ax.set_axis_off()

ax.add_collection3d(surface.shade())

fig.tight_layout(pad=0)
plt.show()