
Polar and Cylindrical Image Mapping
import numpy as np
from matplotlib import pyplot as plt
import s3dlib.surface as s3d
#.. Polar and Cylindrical Image Mapping
# 1. Define functions to examine ....................................
# 2. Setup and map surfaces .........................................
rez=7
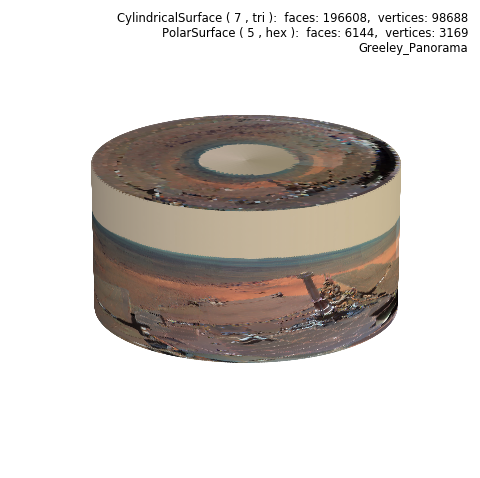
mars_surface = s3d.CylindricalSurface(rez)
mars_surface.map_color_from_image("data/Greeley_Panorama.png")
top_can = s3d.PolarSurface(rez-2)
top_can.map_color_from_image("data/Greeley_Panorama.png")
top_can.transform(translate=[0,0,1])
can = (mars_surface + top_can).transform(scale=[1,1,.5]).shade(0.5,direction=[1,-.5,0])
# 3. Construct figure, add surfaces, and plot ......................
fig = plt.figure(figsize=plt.figaspect(1) )
info = str(mars_surface) + '\n' + str(top_can) + '\nGreeley_Panorama'
fig.text(0.975,0.975,info, ha='right', va='top', fontsize='smaller', multialignment='right')
ax = fig.add_subplot(111, projection='3d', aspect='equal')
minmax = (-0.8,0.8)
ax.set(xlim=minmax, ylim=minmax, zlim=minmax)
ax.set_axis_off()
ax.view_init(20,-75)
ax.add_collection3d(can)
fig.tight_layout()
plt.show()
Original image taken from:
NASA/JPL-Caltech/Cornell/Arizona State Univ.
and then converted to a png filetype.