import numpy as np
from matplotlib import pyplot as plt
import s3dlib.surface as s3d
#.. Mapping to a Viewport
# 1. Define functions to examine ....................................
# 2. Setup and map surfaces .........................................
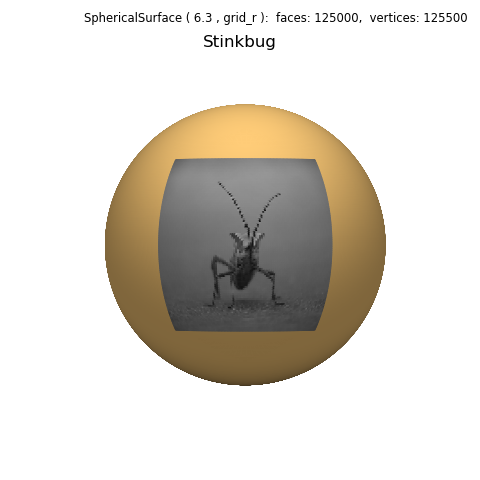
rez=6
vp = [0.15,0.3,0.35,0.70]
bug = s3d.SphericalSurface.grid(250,500, 'r',facecolor=[1.0,.80,.47])
bug.map_color_from_image('data/stinkbug.png',viewport=vp)
bug.shade(direction=[0,1,1],contrast=0.5)
# 3. Construct figure, add surfaces, and plot ......................
fig = plt.figure(figsize=plt.figaspect(1) )
fig.text(0.975,0.975,str(bug), ha='right', va='top', fontsize='smaller', multialignment='right')
ax = fig.add_subplot(111, projection='3d', aspect='equal')
minmax = (-0.8,0.8)
ax.set(xlim=minmax, ylim=minmax, zlim=minmax)
ax.set_title('Stinkbug')
ax.set_axis_off()
ax.view_init(0,90)
ax.add_collection3d(bug)
fig.tight_layout(pad=2.5)
plt.show()