
Line Segment Subdivision
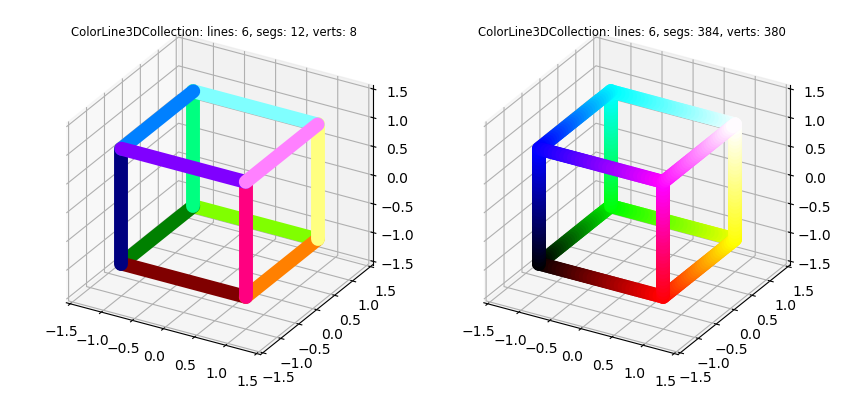
Both plots are a line collection object of six lines. The plot at the right applies the shred method prior to mapping color to subdivide each line into multiple smaller segments. Color mapping uses the segment centers to apply color.
import numpy as np
from matplotlib import pyplot as plt
import s3dlib.surface as s3d
import s3dlib.cmap_utilities as cmu

#..Shred vs unShred box edges

# 1. Define function to examine .....................................

def toRGB(xyz) :
    x,y,z = xyz
    R = (x+1)/2
    G = (y+1)/2
    B = (z+1)/2
    return R,G,B

boxVerts = [
    [  1.0,  1.0,  1.0] ,
    [ -1.0,  1.0,  1.0] ,
    [ -1.0, -1.0,  1.0] ,
    [  1.0, -1.0,  1.0] ,

    [  1.0,  1.0, -1.0] ,
    [ -1.0,  1.0, -1.0] ,
    [ -1.0, -1.0, -1.0] ,
    [  1.0, -1.0, -1.0] ]

boxIndices = [ [4,5,6,7,4], [4,0], [5,1], [6,2], [7,3], [0,1,2,3,0] ]

# 2. Setup and map line .............................................

box1 = s3d.ColorLine3DCollection(boxVerts,boxIndices,linewidth=10)
box1.map_color_from_op(toRGB)

box2 = s3d.ColorLine3DCollection(boxVerts,boxIndices,linewidth=10)
box2.shred(5)
box2.map_color_from_op(toRGB)

# 3. Construct figure, add surface, plot ............................

lines = [ box1, box2 ]

fig = plt.figure(figsize=(8.5,4))
for i,line in enumerate(lines)  :
    ax = fig.add_subplot(121+i, projection='3d', aspect='equal')
    minmax = (-1.5,1.5)
    ax.set(xlim=minmax, ylim=minmax, zlim=minmax )
    ax.set_title(str(line), fontsize='small')
    ax.set_proj_type('ortho')
    ax.add_collection3d(line)

fig.tight_layout()
plt.show()