
Line Colormap Sequence Operation
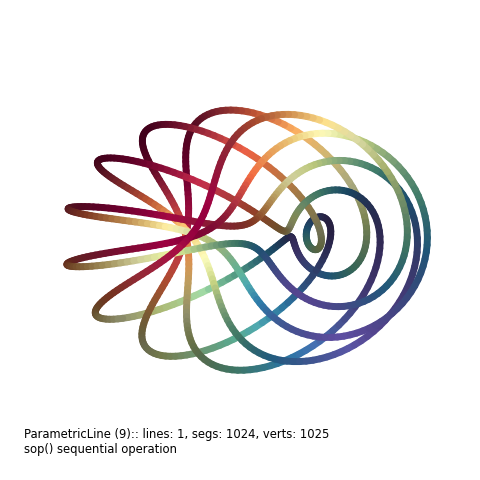
Mapping function definition was taken from the Mayavi 0D and 1D data demo example. The color mapping uses an operation function of the line segment sequence which is highlighted in the following script.
import numpy as np
from matplotlib import pyplot as plt
from matplotlib import colors
import s3dlib.surface as s3d
import s3dlib.cmap_utilities as cmu

#.. plot3d

# 1. Define function to examine .....................................

n_mer, n_long = 6, 11

def sop(t) :
    phi = 2*np.pi*t      # 0 <= phi <= 2pi
    f = np.sin(n_mer * phi)
    return f

def test_plot3d(t) :
    phi = 2*np.pi*t      # 0 <= phi <= 2pi
    x = np.cos(n_mer * phi) * (1 + np.cos(n_long * phi) * 0.5)
    y = np.sin(n_mer * phi) * (1 + np.cos(n_long * phi) * 0.5)
    z = np.sin(n_long * phi) * 0.5
    return x,y,z

# 2. Setup and map line .............................................
rez = 9

line = s3d.ParametricLine(rez,test_plot3d,lw=5)
line.map_cmap_from_sequence('Spectral',sop).shade(0.4,[1,1,.5])

# 3. Construct figure, add surface, and plot ........................

fig = plt.figure(figsize=plt.figaspect(1))
linelabel = str(line)+'\n'+line.cname + '() sequential operation'
fig.text(0.05,0.05,linelabel, ha='left', va='bottom', fontsize='smaller')

ax = plt.axes(projection='3d',facecolor='w', aspect='equal')
ax.set_axis_off()
minmax = (-1,1)
ax.set(xlim=minmax, ylim=minmax, zlim=minmax )
ax.view_init(35,40)

ax.add_collection3d(line)

fig.tight_layout(pad=2)
plt.show()