
Segment Orientation Color
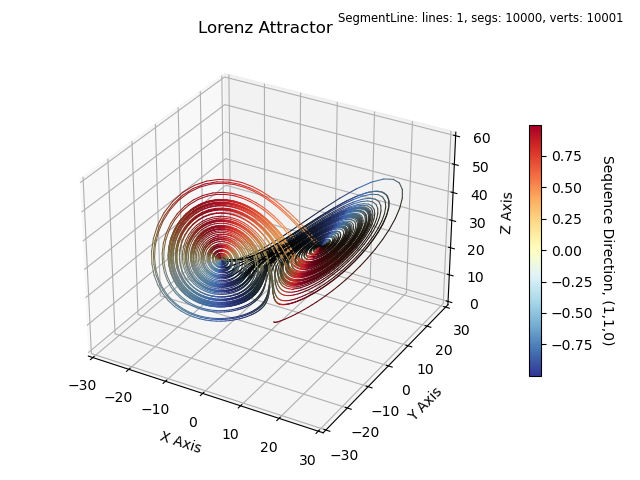
The colormapping of each line segment is based on the direction of the segments defined by the sequential order of the vertex coordinates of the SegmentLine vertCoor constructor argument.
import numpy as np
import matplotlib.pyplot as plt
import s3dlib.surface as s3d
import s3dlib.cmap_utilities as cmu

#.. Lorenz value sequence direction

# 1. Define function to examine .....................................

# +----------------------------------------------------------------------------
# |  The following code between the ========= comments was copied DIRECTLY from
# |  https://matplotlib.org/stable/gallery/mplot3d/lorenz_attractor.html#sphx-glr-gallery-mplot3d-lorenz-attractor-py
# |
# +----------------------------------------------------------------------------
# ===================================================== start of copy.

def lorenz(x, y, z, s=10, r=28, b=2.667):
    """
    Given:
       x, y, z: a point of interest in three dimensional space
       s, r, b: parameters defining the lorenz attractor
    Returns:
       x_dot, y_dot, z_dot: values of the lorenz attractor's partial
           derivatives at the point x, y, z
    """
    x_dot = s*(y - x)
    y_dot = r*x - y - x*z
    z_dot = x*y - b*z
    return x_dot, y_dot, z_dot

dt = 0.01
num_steps = 10000

# Need one more for the initial values
xs = np.empty(num_steps + 1)
ys = np.empty(num_steps + 1)
zs = np.empty(num_steps + 1)

# Set initial values
xs[0], ys[0], zs[0] = (0., 1., 1.05)

# Step through "time", calculating the partial derivatives at the current point
# and using them to estimate the next point
for i in range(num_steps):
    x_dot, y_dot, z_dot = lorenz(xs[i], ys[i], zs[i])
    xs[i + 1] = xs[i] + (x_dot * dt)
    ys[i + 1] = ys[i] + (y_dot * dt)
    zs[i + 1] = zs[i] + (z_dot * dt)

# ===================================================== end of copy.

lineCoor = np.array( [xs,ys,zs] ).T

# 2. Setup and map surfaces .........................................

line = s3d.SegmentLine( lineCoor, "Lorenz Attractor", lw=0.75 )
line.map_cmap_from_direction([1,1,0],'RdYlBu_r',cname='Sequence Direction, (1,1,0)')

# 3. Construct figure, add surface, plot ............................

fig = plt.figure()
ax = plt.axes(projection='3d')
ax.set(xlim=(-30,30), ylim=(-30,30), zlim=(0,60),
       xlabel='X Axis', ylabel='Y Axis', zlabel='Z Axis'  )
fig.text(0.975,0.975,str(line), ha='right', va='top', fontsize='smaller')
ax.set_title( line.name )
cbar = plt.colorbar(line.cBar_ScalarMappable, ax=ax,  shrink=0.6, pad=.09 )
cbar.set_label(line.cname, rotation=270, labelpad = 15)

ax.add_collection3d(line.shade())

fig.tight_layout(pad=1.5)
plt.show()