
Matplotlib Colormaps
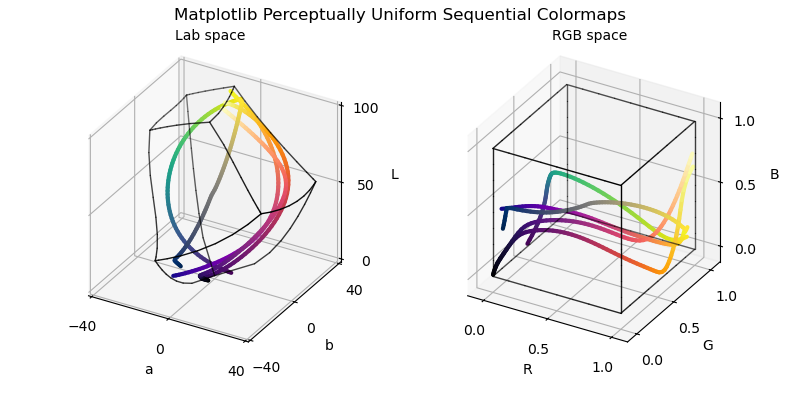
Matplotlib provides a set of 5 perceptually uniform colormaps, Colormap Reference. The above illustration shows these maps in Lab and RGB colorspace.
import copy
import numpy as np
from matplotlib import pyplot as plt
from matplotlib import colormaps
import s3dlib.surface as s3d
import s3dlib.cmap_utilities as cmu
from colorspacious import cspace_converter

#.. Maplotlib Perceptually Uniform Sequential Colormaps

# 1. Define function to examine ....................................

def rgb_to_labCoor(rgb):  # X, Y, Z
    L,a,b = cspace_converter("sRGB1", "CAM02-UCS"  )(rgb.T).T
    return a,b,L

def lab_to_rgbCoor(abl) :
    Lab = np.array([ abl[2],abl[0],abl[1] ])
    rgb = cspace_converter( "CAM02-UCS", "sRGB1" )(Lab.T).T
    return rgb

def cmapRGB(t,cmap):
    if isinstance(cmap,str) : cmap=colormaps[cmap]
    return cmap(t)[:,:3].T

def cmapLab(t,cmap) :
    rgb = cmapRGB(t,cmap)
    return rgb_to_labCoor(rgb)

# 2. Setup and map surface .........................................
lrez, lw = 5, 3
cmaps = ['viridis', 'plasma', 'inferno', 'magma', 'cividis']

rgbLine = None
for cmap in cmaps :
    linefunc = lambda t : cmapRGB(t,cmap)
    line = s3d.ParametricLine(lrez,linefunc)
    line.map_color_from_op(lambda xyz: xyz)
    if rgbLine is None : rgbLine = line
    else : rgbLine += line
rgbLine.set_linewidth(lw)

labLine = None
for cmap in cmaps :
    linefunc = lambda t : cmapLab(t,cmap)
    line = s3d.ParametricLine(lrez,linefunc)
    line.map_color_from_op(lambda abl: lab_to_rgbCoor(abl))
    if labLine is None : labLine = line
    else : labLine += line
labLine.set_linewidth(lw)

#/ ........
rez = 3
cube = s3d.CubicSurface().domain([0,1],[0,1],[0,1])
rgb_edge = cube.edges.shred(rez)
rgb_edge.set_color('k')
rgb_edge.set_linewidth(1)
rgb_edge.fade(.5)
lab_edge = copy.copy(rgb_edge)
lab_edge.map_geom_from_op(rgb_to_labCoor)

# 3. Construct figure, add surface plot ............................

fig = plt.figure(figsize=(8,4))
fig.text( 0.5,0.95, 'Matplotlib Perceptually Uniform Sequential Colormaps',
        ha='center',fontsize='large'  )
minmax, ticks = (-.1,1.1),[0,0.5,1]

ax = fig.add_subplot(121, projection='3d', aspect='equal')
ax.set(xlim=(-40,40), ylim=(-40,40), zlim=(0,100),
    xticks=[-40,0,40],yticks=[-40,0,40],zticks=[0,50,100],
    xlabel='a',ylabel='b',zlabel='L')
ax.set_title( 'Lab space', fontsize='medium')
ax.set_proj_type('ortho')
ax.add_collection3d(labLine)
ax.add_collection3d(lab_edge)

ax = fig.add_subplot(122, projection='3d', aspect='equal')
ax.set(xlim=minmax,ylim=minmax,zlim=minmax,
    xticks=ticks, yticks=ticks, zticks=ticks,
    xlabel='R',ylabel='G',zlabel='B')
ax.set_title( 'RGB space', fontsize='medium')
ax.set_proj_type('ortho')
ax.add_collection3d(rgbLine)
ax.add_collection3d(rgb_edge)

fig.tight_layout(pad=3)
plt.show()
Included in the S3Dlib cmap_utilites module are several functions to provide the generation of colormaps which are sequentially linear in Lab or RGB colorspace. Generated colormaps using these functions are compared in Lab and RGB color space in the following figure.

The functional script for generating the colormaps is shown below.
# Note: the 'green' named color: RGB = [0,0.5,0]
Lab_by = cmx.Lab_cmap_gradient('blue', 'yellow')
Lab_rc = cmx.Lab_cmap_gradient('red',  'cyan')
Lab_gm = cmx.Lab_cmap_gradient([0,1,0],'magenta')
cmaps[0] = [ Lab_by, Lab_rc, Lab_gm ]

by = cmu.rgb_cmap_gradient('blue','yellow')
rc = cmu.rgb_cmap_gradient('red','cyan')
gm = cmu.rgb_cmap_gradient([0,1,0],'magenta')
cmaps[1] = [ by,rc,gm ]

red = cmx.Hue_Lab_gradient('red')
yellow = cmx.Hue_Lab_gradient('yellow')
green = cmx.Hue_Lab_gradient('green')
cyan = cmx.Hue_Lab_gradient('cyan')
blue = cmx.Hue_Lab_gradient('blue')
magenta = cmx.Hue_Lab_gradient('magenta')
cmaps[2] = [yellow,green,cyan,red,blue,magenta]

g = cmx.Cmap_Lab_gradient('gist_rainbow_r')
v = cmx.Cmap_Lab_gradient('viridis')
p = cmx.Cmap_Lab_gradient('plasma')
cmaps[3] = [g,v,p]