
Platonic Solid Edges
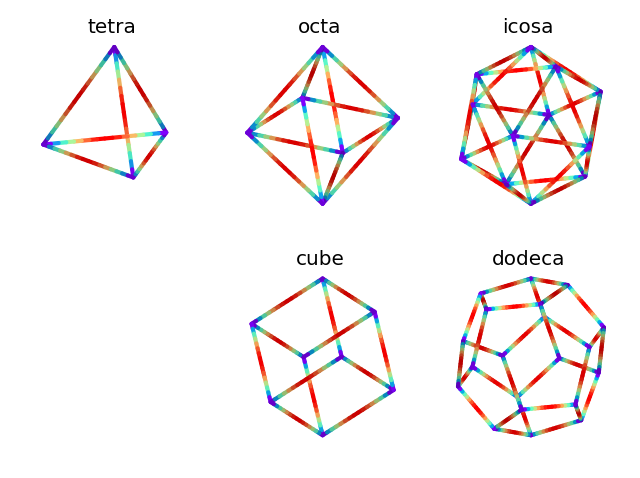
Lines are obtained from surface.edges and then the line segments are further shredded to allow variations along the length of each edges when color mappping is applied.
import numpy as np
import matplotlib.pyplot as plt
import s3dlib.surface as s3d

#.. Platonic Solid Edges

# 1. Define functions to examine ....................................

def radial_Color(xyz) :
    r,t,p = s3d.SphericalSurface.coor_convert(xyz)
    return -r

# 2. Setup and map surfaces .........................................

surfaceType = ['tetra','octa','icosa','','cube','dodeca']

# 3. Construct figure, add surfaces, and plot ......................

fig = plt.figure()
minmax = (-.67,.67)
for i,stgID in enumerate(surfaceType) :
    ax =  fig.add_subplot(231+i, projection='3d', aspect='equal')
    ax.set(xlim=(-1, 1), ylim=(-1, 1), zlim=(-1, 1))
    ax.set_axis_off()
    ax.set(xlim=minmax, ylim=minmax, zlim=minmax)
    if len(stgID) == 0 : continue
    surface = s3d.SphericalSurface.platonic(0,stgID)
    line = surface.edges.shred(4)
    line.set_linewidth(3)
    line.name = stgID
    line.map_cmap_from_op( radial_Color,'rainbow' ).shade(.7)
    ax.set_title(line.name, fontsize='x-large')
    ax.set_proj_type('ortho')
    ax.add_collection3d(line)
    ax.view_init(20,-15)

fig.tight_layout()
plt.show()