import numpy as np
from scipy import special as sp
from matplotlib import pyplot as plt
import s3dlib.surface as s3d
import s3dlib.cmap_utilities as cmu
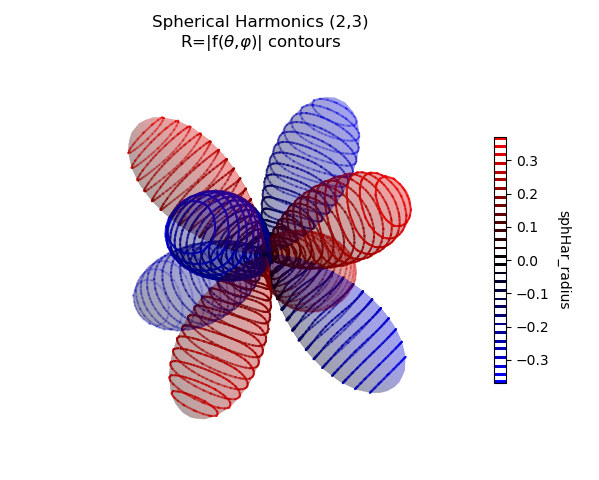
#.. Sphereical Harmonics, contant R contours
# 1. Define functions to examine ....................................
def sphHar(rtp) :
r, theta, phi = rtp
m, l = 2,3
r = sp.sph_harm(m, l, theta, phi).real
return r, theta, phi
def sphHar_absR(rtp) :
r, theta, phi = sphHar(rtp)
return np.abs(r), theta, phi
def sphHar_radius(xyz) :
rtp = s3d.SphericalSurface.coor_convert(xyz,False)
return sphHar(rtp)[0]
# 2. Setup and map surfaces .........................................
rez, nCnt = 5, 15
binmap = cmu.binary_cmap()
k2r = cmu.hsv_cmap_gradient( [0,1,0],[0,1,1])
b2k = cmu.hsv_cmap_gradient( [0.67,1,1],[0.67,1,0])
bkr = cmu.stitch_cmap(b2k,k2r)
sph_23_pos = s3d.SphericalSurface(rez, basetype='octa', cmap=binmap,lw=0)
sph_23_pos.map_cmap_from_op( lambda rtp : sphHar(rtp)[0] )
sph_23_pos.set_surface_alpha(0.2)
sph_23_pos.map_geom_from_op(sphHar_absR)
lines = sph_23_pos.contourLineSet(nCnt)
lines.map_cmap_from_op( sphHar_radius, cmap=bkr )
# 3. Construct figure, add surfaces, and plot .....................
minmax = (-.25,0.25)
fig = plt.figure(figsize=plt.figaspect(0.8))
ax = plt.axes(projection='3d', aspect='equal')
ax.set(xlim=minmax, ylim=minmax, zlim=minmax )
ax.set_title('Spherical Harmonics (2,3)\n'+r'R=|f($\theta$,$\varphi$)|'+' contours')
cbar = plt.colorbar(lines.stcBar_ScalarMappable(2*nCnt,'w'), ax=ax, shrink=0.6 )
cbar.set_label(lines.cname, rotation=270, labelpad = 15)
ax.set_axis_off()
ax.add_collection3d(sph_23_pos.shade())
ax.add_collection3d(lines.fade())
fig.tight_layout()
plt.show()