
Complex Cylindrical Contours
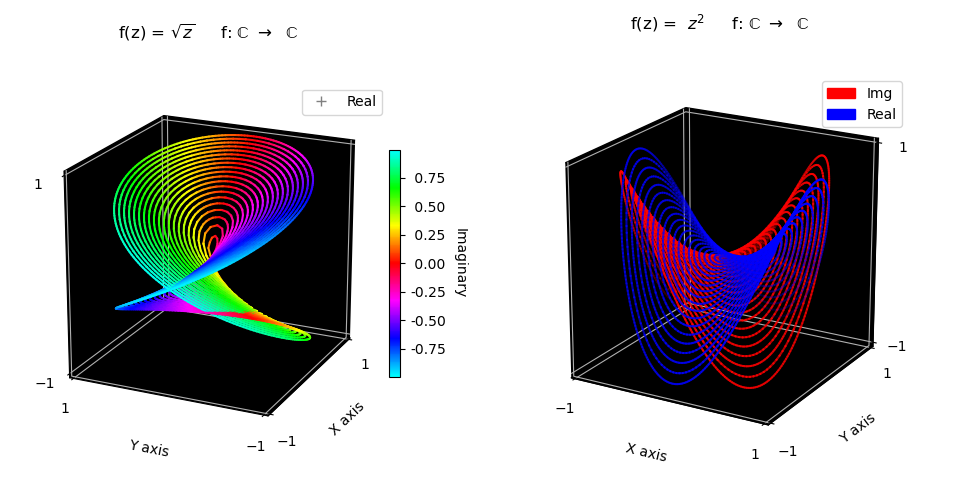
This script originated from a direct copy of the surface construction Complex Number Representation, Geometry and Colormap example. Unnecessary lines were commented out. The highlighted lines show the contours created directly from these surfaces. The default contour line color is the surface color from which the contour is constructed.
Similar to the Elevation Contours of a Datagrid example, a black background was placed over the grid to enhance the color contrast (blackGB function ).
import numpy as np
import matplotlib.pyplot as plt
import matplotlib.patches as mpatches
import matplotlib.lines as mlines
from matplotlib.ticker import LinearLocator, FormatStrFormatter
import s3dlib.surface as s3d
import s3dlib.cmap_utilities as cmu

#.. Complex Number Representation, Geometry and Colormap: Polar Coordinates
#   note: copy from surface representation for contour construction.
# 1. Define functions to examine ....................................

real = True
imaginary =  not real

def sqrt_Z(rtz, isReal) :
    r,t,z = rtz
    T=2*t
    if isReal :  Z = np.sqrt(r)*np.cos(T/2)
    else :       Z = np.sqrt(r)*np.sin(T/2)
    return r,T,Z

def square_Z(rtz, isReal) :
    r,t,z = rtz
    if isReal : Z = r*r*np.cos(2*t)
    else :      Z = r*r*np.sin(2*t)
    return r,t,Z

# 2. Setup and map surfaces .........................................

zMap = cmu.hsv_cmap_gradient( [.5,1,1], [1.5,1,1] )
bmap = cmu.binary_cmap()

surface_1 = s3d.PolarSurface(5, cmap=zMap,linewidth=0.1)
surface_1.map_cmap_from_op( lambda rtz : sqrt_Z(rtz,imaginary)[2] )
surface_1.map_geom_from_op( lambda rtz : sqrt_Z(rtz,real) )
#surface_1.set_edgecolor([0,0,0])

surface_I = s3d.PolarSurface(5, facecolor='red')
surface_I.map_geom_from_op( lambda rtz : square_Z(rtz,imaginary) )
surface_R = s3d.PolarSurface(5, facecolor='blue')
surface_R.map_geom_from_op( lambda rtz : square_Z(rtz,real) )

#surface_2 = surface_I + surface_R
#surface_2.shade(direction=[1,1,1])

# ..... construct contours from surfaces ......

line_1 = surface_1.contourLineSet(20,coor='c',name='real sqrt contours')

line_I = surface_I.contourLineSet(20,coor='c',name='imag sqar contours')
line_R = surface_R.contourLineSet(20,coor='c',name='real sqar contours')

line_2 = line_I + line_R

# 3. Construct figure, add surfaces, and plot .....................

def formatAxis(ax) :
    minmax, ticks = (-1,1) ,  [-1,1]
    ax.set(xlim=minmax, ylim=minmax, zlim=minmax,
            xticks=ticks, yticks=ticks, zticks=ticks,
            xlabel='X axis', ylabel='Y axis')
    ax.xaxis.set_pane_color('k')
    ax.yaxis.set_pane_color('k')
    ax.zaxis.set_pane_color('k')
    return

fcc = r'     f: $\mathrm{\mathbb{C}}$ $\to$  $\mathrm{\mathbb{C}}$' +'\n\n'
minmax, ticks = (-1,1) ,  [-1,1]
fig = plt.figure(figsize=plt.figaspect(0.6/1.2))

ax1 = fig.add_subplot(121, projection='3d', aspect='equal')
formatAxis(ax1)
ax1.view_init(20, 205)
ax1.set_title( r'f(z) = $\sqrt{z}$' + fcc )
cbar = plt.colorbar(surface_1.cBar_ScalarMappable, ax=ax1,  shrink=0.6, pad=0.0 )
cbar.set_label('Imaginary', rotation=270, labelpad = 15)
cbar.ax.yaxis.set_major_formatter(FormatStrFormatter('%5.2f'))
real_handle = mlines.Line2D([], [], color='grey', marker='+', linestyle='None',
                          markersize=7, label='Real')
ax1.legend(handles=[real_handle])

ax2 = fig.add_subplot(122, projection='3d', aspect='equal')
formatAxis(ax2)
ax2.view_init(20)
ax2.set_title( r'f(z) =  $z^2$' + fcc )
red_patch = mpatches.Patch(color='red', label='Img')
blue_patch = mpatches.Patch(color='blue', label='Real')
ax2.legend(handles=[red_patch,blue_patch])

#ax1.add_collection3d(surface_1)
#ax2.add_collection3d(surface_2)
ax1.add_collection3d(line_1)
ax2.add_collection3d(line_2.fade())


fig.tight_layout(pad=2)
plt.show()