import numpy as np
import matplotlib.pyplot as plt
from matplotlib.ticker import LinearLocator
import s3dlib.surface as s3d
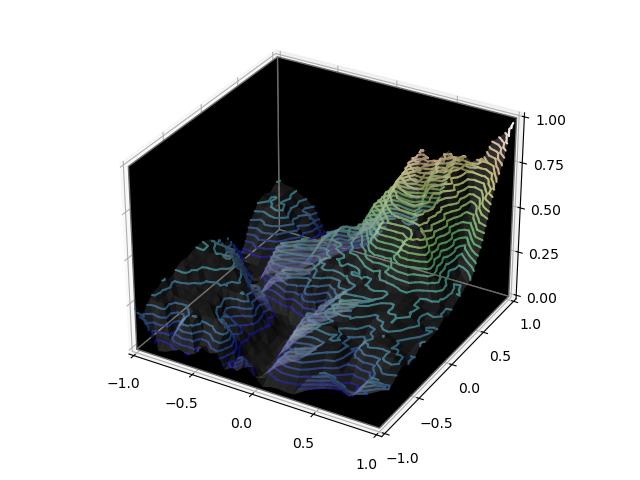
#.. Datagrid Z contour set line plot
# 1. Define function to examine .....................................
def blackGB():
v = [ [1.0,-1.0,0.0],[1.0,1.0,0.0],[-1.0,1.0,0.0],[-1.0,-1.0,0.0],
[1.0,-1.0,1.0],[1.0,1.0,1.0],[-1.0,1.0,1.0],[-1.0,-1.0,1.0] ]
f = [ [0,1,2,3], [1,5,6,2], [2,6,7,3]]
e = [ [0,1],[1,2],[2,3],[3,0],[1,5],[5,6],[6,7],[7,3],[2,6] ]
return s3d.Surface3DCollection(v,f,e,color='k',edgecolor='dimgrey')
z=np.load('data/jacksboro_fault_dem.npz')['elevation']
datagrid = np.flip( z[5:50, 5:50], 0 )
# 2. Setup and map surfaces .........................................
rez=4
ls = s3d.elev_azim_2vector(0,-135)
surface = s3d.PlanarSurface(rez, basetype='oct1', color='w',lw=0)
surface.map_geom_from_datagrid( datagrid ).shade(direction=ls).set_surface_alpha(0.2)
elev = surface.contourLineSet(30)
elev.map_cmap_from_op(lambda xyz: xyz[2], cmap='gist_earth')
# 3. Construct figure, add surface, plot ............................
fig = plt.figure()
ax = plt.axes(projection='3d')
ax.set(xlim=(-1,1), ylim=(-1,1), zlim=(0,1) )
ax.xaxis.set_major_locator(LinearLocator(5))
ax.yaxis.set_major_locator(LinearLocator(5))
ax.zaxis.set_major_locator(LinearLocator(5))
ax.add_collection3d(blackGB())
ax.add_collection3d(surface)
ax.add_collection3d(elev)
fig.tight_layout()
plt.show()