
Mandelbrot Contours
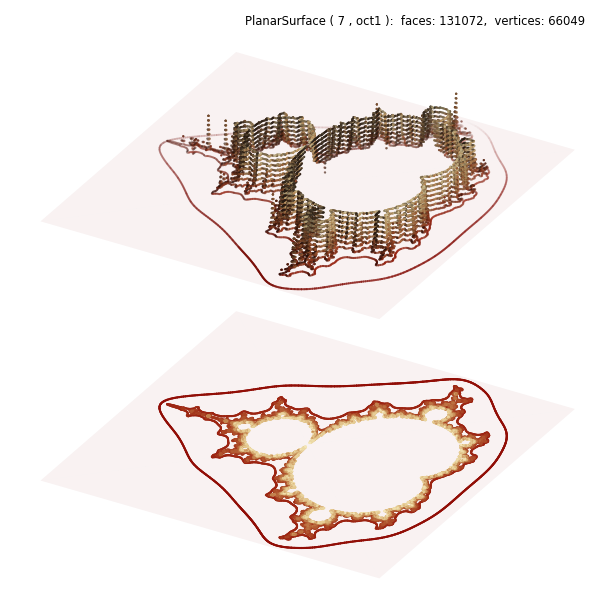
This is a minor change to the script from Datagrid Alternative to Image Construction, as highlighted in the script below. Contours may be created from any surface already constructed using the color of the surface. Surface shading and highlighting is incorporated into the contour coloring.
Note
This is a special case where the contours are created after the surface is clipped. Usually, contours must be constructed before the surface is clipped. However, in this case, faces were removed which did not intersect with the contour lines set.
# +----------------------------------------------------------------------------
# |  The following code between the ========= comments was copied DIRECTLY from
# |  https://matplotlib.org/stable/gallery/showcase/mandelbrot.html
# |
# +----------------------------------------------------------------------------
# ===================================================== start of copy.
import numpy as np


def mandelbrot_set(xmin, xmax, ymin, ymax, xn, yn, maxiter, horizon=2.0):
    X = np.linspace(xmin, xmax, xn).astype(np.float32)
    Y = np.linspace(ymin, ymax, yn).astype(np.float32)
    C = X + Y[:, None] * 1j
    N = np.zeros_like(C, dtype=int)
    Z = np.zeros_like(C)
    for n in range(maxiter):
        I = abs(Z) < horizon
        N[I] = n
        Z[I] = Z[I]**2 + C[I]
    N[N == maxiter-1] = 0
    return Z, N


if __name__ == '__main__':
    import time
    import matplotlib
    from matplotlib import colors
    import matplotlib.pyplot as plt

    xmin, xmax, xn = -2.25, +0.75, 3000 // 2
    ymin, ymax, yn = -1.25, +1.25, 2500 // 2
    maxiter = 200
    horizon = 2.0 ** 40
    log_horizon = np.log2(np.log(horizon))
    Z, N = mandelbrot_set(xmin, xmax, ymin, ymax, xn, yn, maxiter, horizon)

    # Normalized recount as explained in:
    # https://linas.org/art-gallery/escape/smooth.html
    # https://www.ibm.com/developerworks/community/blogs/jfp/entry/My_Christmas_Gift

    # This line will generate warnings for null values but it is faster to
    # process them afterwards using the nan_to_num
    with np.errstate(invalid='ignore'):
        M = np.nan_to_num(N + 1 - np.log2(np.log(abs(Z))) + log_horizon)

    # ===================================================== end of copy.
    import copy
    from matplotlib import cm
    from matplotlib.colors import ListedColormap
    import s3dlib.surface as s3d
    import s3dlib.cmap_utilities as cmu

    # 1. Define functions to examine ....................................

    pNorm = lambda x,n : np.power(x,n)
    amax =np.amax(M)
    M = np.where(M<0.1, 1, M/amax)
    datagrid = pNorm(M,0.2)

    def clipZ(xyz) :
        x,y,z = xyz
        return x,y,np.clip(z,0,1)

    # 2. Setup and map surfaces .........................................
    blacktop = cmu.hsv_cmap_gradient('darkred','lemonchiffon')
    blacktop = blacktop(np.linspace(0, 1, 256))
    blacktop[-2:] = np.array( [0,0,0,1] )
    blacktop = ListedColormap(blacktop)
    rez=7

    surface = s3d.PlanarSurface(rez, basetype='oct1', cmap=blacktop)
    surface.map_geom_from_datagrid( datagrid )
    surface.map_geom_from_op(clipZ)
    surface.map_cmap_from_op()

    surface.transform(translate=[0,0,1.0])  # move up to 1.0
    flat_lines = copy.copy(surface).contourLineSet(10)
    flat_lines.map_geom_from_op(lambda c: [c[0],c[1],-2*np.ones_like(c[0])] )

    plane_1 = s3d.PlanarSurface(color='darkred').domain(zcoor=1.4)
    plane_2 = s3d.PlanarSurface(color='darkred').domain(zcoor=-2)
    planes = (plane_1 + plane_2).set_surface_alpha(0.05)

    # 3. Construct figure, add surface, plot ............................

    fig = plt.figure(figsize=(6,6))

    fig.text(0.975,0.975,str(surface), ha='right', va='top',
            fontsize='smaller', multialignment='right')
    ax = plt.axes(projection='3d')
    ax.set(xlim=(-.9,0.9), ylim=(-.9,0.9), zlim=(-1.5,1.5) )
    ax.set_axis_off()
    ax.set_proj_type('ortho')

    ax.add_collection3d(surface.shade().contourLineSet(10).fade(0,75,-70))
    ax.add_collection3d(flat_lines)
    ax.add_collection3d(planes)

    fig.tight_layout()
    plt.show()