
MRI Contours 2D plot
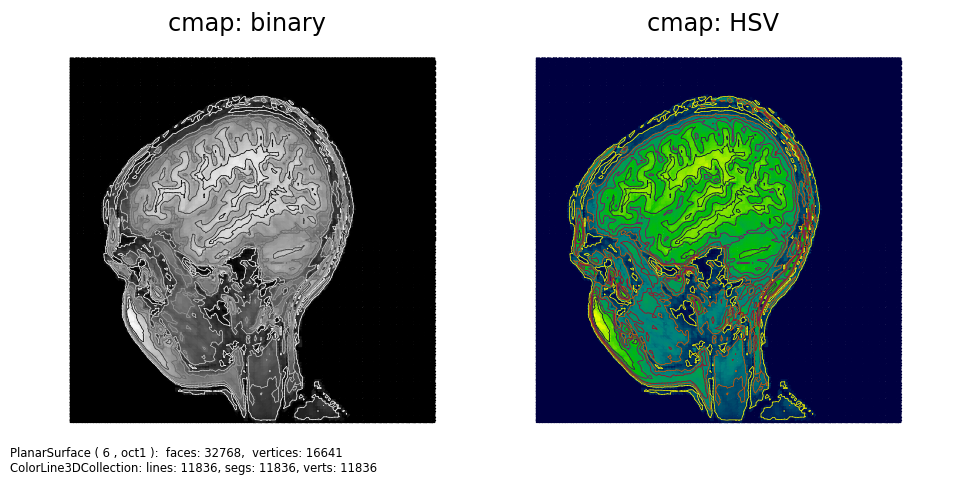
Similar to the MRI Regions example, 3D surface and contours are viewed normal to the xy-plane. The surface colormap and contour colormap are compliments to each other for contrast. The colormaps are shown below.

import gzip
import copy
import numpy as np
from matplotlib import pyplot as plt
import s3dlib.surface as s3d
import s3dlib.cmap_utilities as cmu

#.. MRI contours 2D plot

# 1. Define function to examine .....................................

with gzip.open('data/s1045.ima.gz') as datafile:
    s = datafile.read()
Z = np.frombuffer(s, np.uint16).astype(float).reshape((256, 256))
Z = np.flip(Z,0)

# 2. Setup and map surfaces .........................................
rez=6
cmu.hsv_cmap_gradient( [0.666,1,.25], [0.166,1,1], 'HSV_b-y' )
cmu.hsv_cmap_gradient( [1.166,1,1], [0.666,1,.25], 'HSV_y-b' )

surf = s3d.PlanarSurface(rez, basetype='oct1', name='MRI')
surf.map_geom_from_datagrid( Z, scale=.3 )
cont = surf.contourLineSet(6)
cont.set_linewidth(.5)

kwsurf,kwcont = copy.copy(surf),  copy.copy(cont)

kwsurf.map_cmap_from_datagrid( Z,'binary_r', cname='cmap: binary' )
kwcont.map_cmap_from_op( lambda c: c[2], 'binary' )
surf.map_cmap_from_datagrid( Z,'HSV_b-y',    cname='cmap: HSV' )
cont.map_cmap_from_op( lambda c: c[2], 'HSV_y-b' )

surfaces = [kwsurf, surf]
contour  = [kwcont, cont]

# 3. Construct figure, add surface, plot ............................
info = str(surf) +'\n'+ str(cont)

minmax = (-.7,.7)
fig = plt.figure(figsize=plt.figaspect(0.5))
fig.text(0.01,0.01,info, ha='left', va='bottom', fontsize='smaller')
for i,surface in enumerate(surfaces) :
    ax = fig.add_subplot(121+i, projection='3d')
    ax.set_proj_type('ortho')
    ax.set(xlim=minmax, ylim=minmax, zlim=minmax )
    ax.set_axis_off()
    ax.view_init(90,-90)
    ax.set_title(surface.cname, fontsize='xx-large')

    ax.add_collection3d( surface )
    ax.add_collection3d(contour[i].transform(translate=[0,0,1]))

fig.tight_layout(pad=2)
plt.show()