
MRI Regions
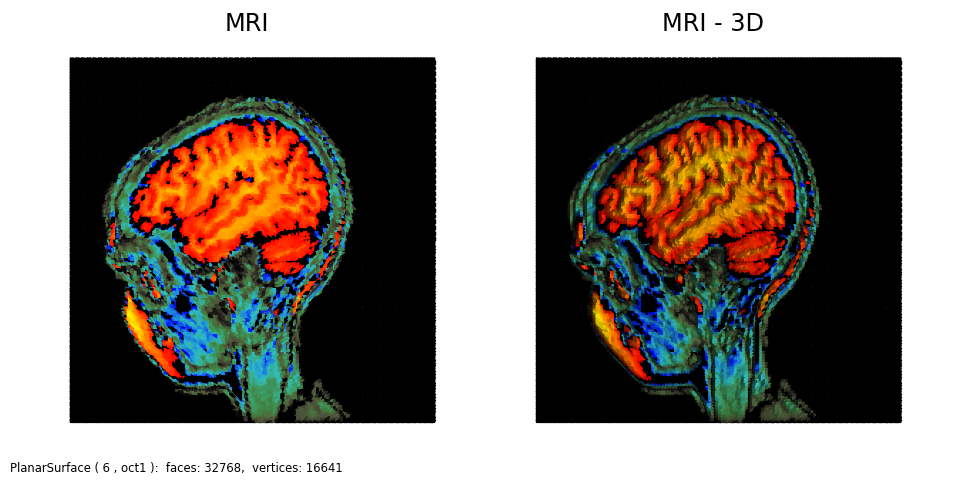
Similar to the MRI 3D example, the following colormap was used to focus specific regions of the scan.

import gzip
import copy
import numpy as np
from matplotlib import pyplot as plt
import s3dlib.surface as s3d
import s3dlib.cmap_utilities as cmu

# colormapped MRI

# 1. Define function to examine .....................................

with gzip.open('data/s1045.ima.gz') as datafile:
    s = datafile.read()
Z = np.frombuffer(s, np.uint16).astype(float).reshape((256, 256))
Z = np.flip(Z,0)

# 2. Setup and map surfaces .........................................
rez=6
cmu.hsv_cmap_gradient('k','b', name='k2b')
cmu.rgb_cmap_gradient('k','k',name='black')
cmu.stitch_cmap( 'k2b', 'black', 'autumn', bndry=[.4,.55], name='MRI' )

surface = s3d.PlanarSurface(rez, basetype='oct1', name='MRI')
surface.map_cmap_from_datagrid( Z, 'MRI' )
surface3D = copy.copy(surface)
surface3D.map_geom_from_datagrid( Z, scale=.3, name='MRI - 3D' ).shade()

surfaces = [surface, surface3D]

# 3. Construct figure, add surface, plot ............................

minmax = (-.7,.7)
fig = plt.figure(figsize=plt.figaspect(0.5))
fig.text(0.01,0.01,str(surface), ha='left', va='bottom', fontsize='smaller')
for i,surface in enumerate(surfaces) :
    ax = fig.add_subplot(121+i, projection='3d')
    ax.set_proj_type('ortho')
    ax.set(xlim=minmax, ylim=minmax, zlim=minmax )
    ax.set_axis_off()
    ax.view_init(90,-90)
    ax.set_title(surface.name, fontsize='xx-large')

    ax.add_collection3d( surface )

fig.tight_layout(pad=2)
plt.show()