
Contour Projections
The Townsend function is given on the Wikipedia page Test functions for constrained optimization.
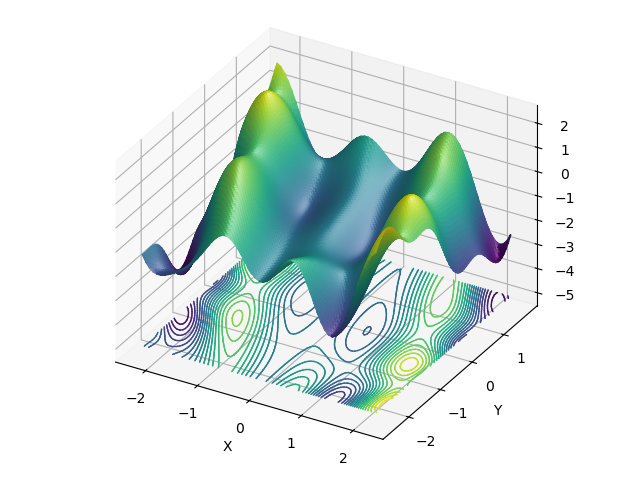
Several construction techniques are exemplified in this plot.
The geometric function, townsend, is not scaled, but instead, the surface domain is changed using the surface domain method (line 21)
The same default direction of [0,0,1] is used for three separate purposes.
To apply the colormap direction onto the surface (line 20).
To set the orientation normal to the contour planes (line 22). The contours will take the color of the surface.
To collapse the colored contours on a plane with normal to the direction (line 23).
Surface is then shaded and highlighted when added to the axes (line 36). This occurs after contour construction so the contour colors are not changed.
The axes are auto scaled based on the domains of the two objects added to the axes. (line 31)
 1 import numpy as np
 2 import matplotlib.pyplot as plt
 3 import s3dlib.surface as s3d
 4
 5 #.. Function XY Surface Contours, XY Projection with Z direction surface colormapping.
 6
 7 # 1. Define function to examine ....................................
 8
 9 def townsend(xyz) :
10     x,y,z = xyz
11     A = -np.cos( (x-0.1)*y )**2
12     B = -np.sin(3*x + y)
13     return x, y, (A + x*B)
14
15 # 2. Setup and map surface .........................................
16 rez,offset = 6, -5
17
18 plane = s3d.PlanarSurface(rez).domain( 2.25, (-2.5, 1.75) )
19 plane.map_geom_from_op(townsend)
20 plane.map_cmap_from_op()            # default: z-direction
21
22 contours = plane.contourLineSet(20) # default: planar, z-direction
23 contours.map_to_plane(offset)       # default: planar, z-direction
24 contours.set_linewidth(1)
25
26 # 3. Construct figure, add surface plot ............................
27
28 fig = plt.figure()
29 ax = plt.axes(projection='3d', proj_type='ortho')
30 ax.set( xlabel='X', ylabel='Y')
31 s3d.auto_scale(ax,plane,contours)
32
33 ax.add_collection3d(plane.shade(0.5).hilite(.5))
34 ax.add_collection3d(contours)
35
36 fig.tight_layout(pad=0)
37 plt.show()