
Domain Coloring, 2D from 3D
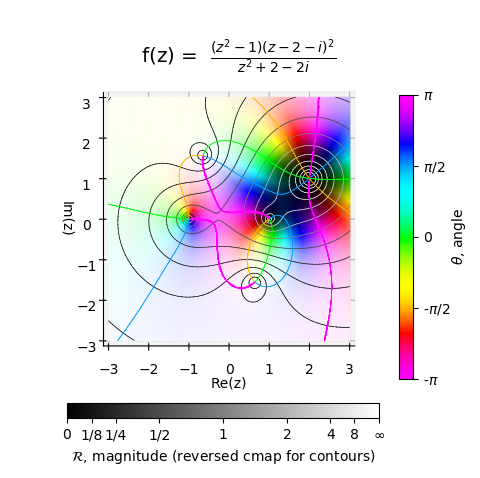
This example uses the functions from the Domain Coloring example, with the addition of a function to construct contours at the surface discontinuities.
For the 2D figure below, the ‘flat’ PlanarSurface was used to construct most of the contours directly from the xy-surface. However for the discontinuous contours, the 3D θ-surface was used with the application of the discontinuity_contours function.
import numpy as np
from matplotlib import pyplot as plt
import s3dlib.surface as s3d
import s3dlib.cmap_utilities as cmu
import copy
#.. Domain Coloring 2D Contours
# 1. Define function to examine .....................................
def complexFunc(z):
# https://en.wikipedia.org/wiki/Domain_coloring
i = 1j
num = (z**2 - 1)*(z - 2 -i)**2
dem = z**2 + 2 + 2*i
return num/dem
def funcRT(xyz) :
x,y,z = xyz
c = np.array(x,dtype=complex)
c.imag = np.array(y)
f = complexFunc(c)
r = np.abs(f) #.. [0,inf]
Z = 2*np.arctan(r)/np.pi #.. [0,1]
theta = (1 + np.angle(f)/np.pi)/2 #.. [0,1]
return Z,theta
coor_radius = lambda c: [c[0],c[1],funcRT(c)[0]]
coor_theta = lambda c: [c[0],c[1],funcRT(c)[1]]
isContinuous = lambda c,N: np.abs(N.T[2]) > 0.02
def domainColor(xyz) :
Z,theta = funcRT(xyz)
h,s,v = hsl_to_hsv(theta,1,Z)
H = (h+5/6)%1 # cmap starts at magenta(5/6), not red(0)
return H,s,v
def hsl_to_hsv(h, s, l):
# from: https://gist.github.com/mathebox/e0805f72e7db3269ec22
# Modified for arrays, used Numpy instead of python math.
v = (2*l + s*(1-np.abs(2*l-1)))/2
s = 2*(v-l)/v
return h, s, v
def discontinuity_contours(surface) :
# --- discontinuity @ theta = -pi and pi
tnorms = surface.facenormals(v3d=False)
tcentr = surface.facecenters
discon = np.logical_not(isContinuous(tcentr,tnorms)) # keep discontinuous faces
disCen = tcentr.T[discon,:] # facecenters only facesnormals not in xy plane.
disCen[:,2] = np.zeros(disCen.shape[0]) # flatten to xy plane @ 0 ( -pi )
topCen = copy.copy(disCen)
topCen[:,2] = np.ones(topCen.shape[0]) # flatten to xy plane @ 1 ( pi )
disCen = np.concatenate((disCen,topCen),axis=0)
disLine = s3d.SegmentLine(disCen)
segLens = np.linalg.norm(disLine.segmentdirections,axis=1)
disLine.clip(lambda c : segLens < 0.35 ) # remove segments too long.
return disLine
# 2. Setup and map surfaces .........................................
rez = 6
cmu.hue_cmap('m','+m',name='myc')
surfaces,lines = [None]*2, [None]*2
surface = s3d.PlanarSurface(rez,color='grey').domain([-3,3],[-3,3])
surface.map_geom_from_op( coor_radius )
surfaces[0]=surface
conval = [ 2**i for i in range(-6,7)]
magval = [ 2*np.arctan(v)/np.pi for v in conval]
line = surface.contourLines(*magval,color='k')
line.set_linewidth(1)
lines[0] = line
# note: higher rez due to surface discontinuity.
surface = s3d.PlanarSurface(rez+2,color='grey').domain([-3,3],[-3,3])
surface.map_geom_from_op( coor_theta )
disLine = discontinuity_contours(surface) #.. access before clipping
normals = surface.facenormals(v3d=False)
surface.clip(lambda c : isContinuous(c,normals))
surfaces[1]=surface
t_cbvals = [0.002, 0.25, 0.5, 0.75, 0.998]
t_axvals = [ v for v in t_cbvals ]
line = surface.contourLines(*t_axvals,color='r')
line.map_cmap_from_op( lambda c: c[2], 'myc' )
lines[1] = line
# 3. Construct figure, add surface, plot ............................
elev,azim = 20,150
r_labels = [ '0','1/8','1/4','1/2','1','2','4','8',r'$\infty$']
r_axvals = [0] + [ 2*np.arctan(2**i)/np.pi for i in range(-3,4)] + [1]
t_labels = [r'-$\pi$',r'-$\pi$/2','0',r'$\pi$/2',r'$\pi$']
t_axvals = [ v/4 for v in range(0,5)]
z_ticks = [r_axvals,t_axvals]
z_axlab = [r_labels,t_labels]
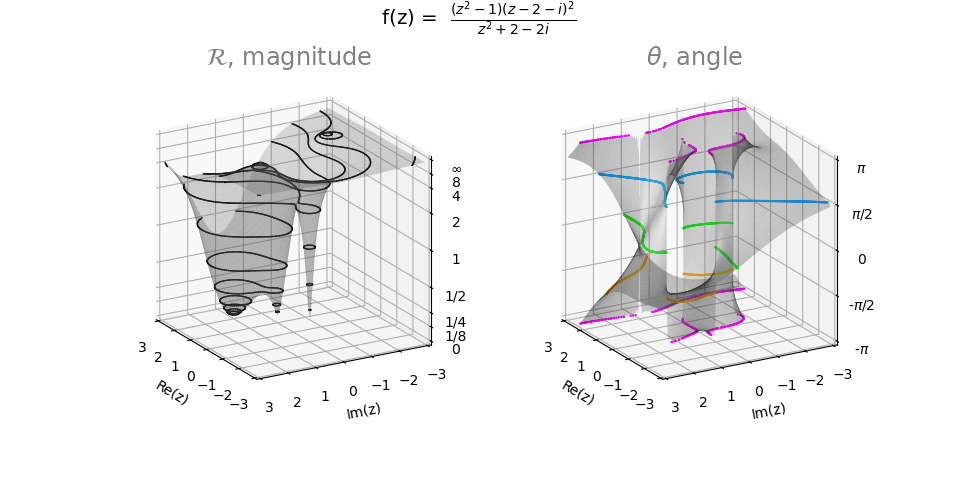
title = [ r'$\mathcal{R}$, magnitude', r'$\theta$, angle']
fig = plt.figure(figsize=plt.figaspect(0.5/1))
info = r" f(z) = $\frac{(z^{2}-1)(z-2-i)^{2}}{z^{2}+2+2i}$ "
fig.text(0.5,1,info, ha='center', va='top', fontsize='x-large')
for i,surface in enumerate(surfaces) :
ax = fig.add_subplot(121+i, projection='3d', aspect='equal')
ax.view_init(elev,azim)
#ax.view_init(89.9,-90.01) # <-- 2D-view from top
ax.set_proj_type('ortho')
ax.set_title('\n'+title[i],color='grey', fontsize='xx-large')
ax.set(xlim=( -3,3 ), ylim=( -3,3 ), zlim=( 0,1), zticks=z_ticks[i],
xlabel='Re(z)', ylabel='Im(z)' )
ax.set_zticklabels(z_axlab[i])
surface.set_surface_alpha(0.25)
surface.shade(0.25,ax=ax,direction=[0,1,1])
if i==1 : surface.hilite(0.7,direction=[0,1,1])
ax.add_collection3d(surface)
ax.add_collection3d(lines[i])
fig.tight_layout(pad=-2)
# =======================================================================
# Domain Color Map ======================================================
# 2. Setup and map surfaces .........................................
cmu.hue_cmap('m','+m',name='mycym')
surface = s3d.PlanarSurface(rez,cmap='mycym').domain([-3,3],[-3,3])
surface.map_color_from_op( domainColor, rgb=False )
line_0 = surfaces[0].contourLines(*magval)
line_0.map_cmap_from_op(lambda c: c[2], 'binary')
line_0.set_linewidth(.5)
line_1 = surfaces[1].contourLines(*t_axvals)
line_1 += disLine # <-- add contours @ -pi and pi
line_1.map_cmap_from_op( lambda c: c[2], 'myc' )
line_1.set_linewidth(.5)
# 3. Construct figure, add surface, plot ............................
cbval_a = [-1,-.5,0,0.5,1]
fig = plt.figure(figsize=plt.figaspect(1))
fig.text(0.5,.92,info, ha='center', va='top', fontsize='x-large')
ax = plt.axes(projection='3d')
ax.set(xlim=( -3,3 ), ylim=( -3,3 ), zlim=( 0,1 ),
zticks=[], xlabel='Re(z)', ylabel='Im(z)' )
ax.view_init(89.9,-90.01)
ax.set_proj_type('ortho')
cbar = plt.colorbar(surface.cBar_ScalarMappable, ax=ax, ticks=cbval_a, shrink=0.6, pad=-.1 )
cbar.ax.set_yticklabels(t_labels)
cbar.set_label(r'$\theta$, angle', rotation=90, labelpad = 0)
sm = plt.cm.ScalarMappable(cmap='binary_r')
sm.set_array([])
cbar2 = fig.colorbar(sm, ax=ax, ticks=r_axvals,shrink=0.7, pad=-.1, orientation='horizontal' )
cbar2.ax.set_xticklabels(r_labels)
cbar2.set_label(r'$\mathcal{R}$, magnitude (reversed cmap for contours)')
ax.add_collection3d(surface)
ax.add_collection3d(line_0)
ax.add_collection3d(line_1)
fig.tight_layout(pad=0)
# =======================================================================
plt.show()