
Face Edges from Image HSV Value Clipping
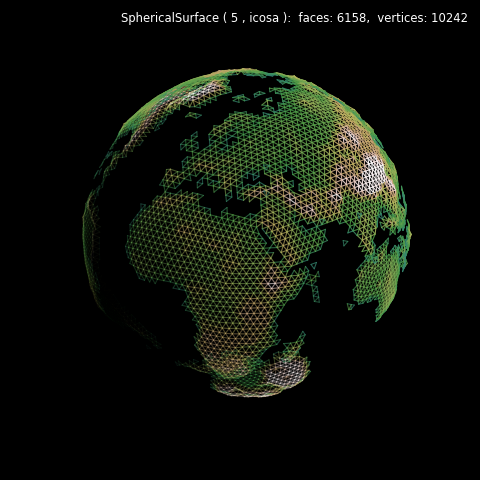
A custom colormap, hiTerrain, was constructed from the last 67% of the Matplotlib colormap gist_earth using the color map utilities function section_cmap.

This cmap was then used to eliminate the blue color since only land mass is shown in the contours.
import numpy as np
from matplotlib import pyplot as plt
import s3dlib.surface as s3d
import s3dlib.cmap_utilities as cmu

#.. Face Edges from Image HSV Value Clipping

Radial = lambda xyz : s3d.SphericalSurface.coor_convert(xyz,False)[0]

# 2. Setup and map surfaces .........................................
rez = 5
cmu.section_cmap('gist_earth',0.33,1.0,'hiTerrain')

earth = s3d.SphericalSurface(rez)
earth.map_color_from_image('data/elevation.png')
earth.clip_alpha(.1,useval=True)
earth.map_geom_from_image('data/elevation.png',scale=0.03)

edges = earth.edges
edges.map_cmap_from_op(Radial,'hiTerrain' )
edges.set_linewidth(0.8)

# 3. Construct figure, add surfaces, and plot ......................

minmax = (-0.80,0.80)
text = str(earth)
fig = plt.figure(figsize=plt.figaspect(1), facecolor='black' )
fig.text(0.975,0.975,text, ha='right', va='top',
        fontsize='smaller', multialignment='right', color='white')
ax = plt.axes(projection='3d', aspect='equal', facecolor='k')
ax.set(xlim=minmax, ylim=minmax, zlim=minmax)
ax.set_axis_off()
ax.view_init(25,-150)
ax.add_collection3d(edges.fade())

fig.tight_layout(pad=1)
plt.show()