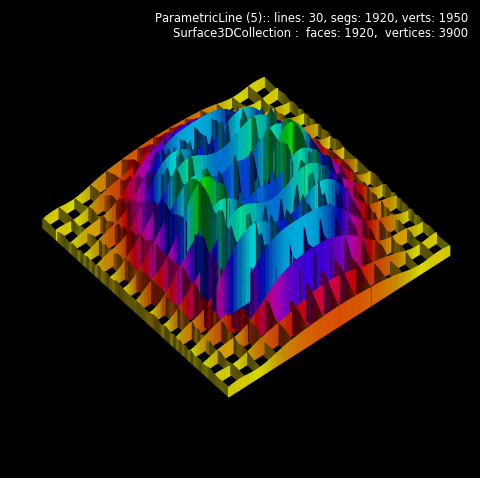
import numpy as np
import matplotlib.pyplot as plt
import s3dlib.surface as s3d
import s3dlib.cmap_utilities as cmu

#.. ParametricLine Wireframe Surface plot

# 1. Define function to examine .....................................
def fun011(xyz) :
    x,y,z = xyz
    X2, Y2 = x**2, y**2
    a,b = 0.04, 0.06
    R2 = a*X2 + b*Y2
    one = np.ones(len(x))
    f = np.sin( X2 + 0.1*Y2)/( 0.1*one + R2 )
    g = ( X2 + 1.9*Y2) * np.exp( one - R2)/4
    Z = f + g
    return x,y,Z

# 2. Setup and map surfaces .........................................
rez=5
cmap = cmu.hsv_cmap_gradient([1.166,1,1],[0.333,1,1])

line = s3d.ParametricLine(rez,lw=0.5)
line.map_xySlice_from_op( fun011, xset=15, yset=15, xlim=10, ylim=10 )
line.map_cmap_from_op(lambda xyz : np.abs(xyz[2]), cmap ).shade(.6)

surface = line.get_filled_surface(dist=-1)

# 3. Construct figures, add surface, plot ...........................

fig = plt.figure(figsize=plt.figaspect(1), facecolor='black')
fig.text(0.975,0.975,str(line)+'\n'+str(surface), ha='right', va='top',
        fontsize='smaller', multialignment='right', color='white')
ax = plt.axes(projection='3d')
minmax = (-10,10)
ax.set(xlim=minmax, ylim=minmax, zlim=minmax)
ax.set_axis_off()
ax.set_facecolor('black')
ax.set_proj_type('ortho')
ax.view_init(50,140)

ax.add_collection3d(surface.shade())

fig.tight_layout(pad=0)
plt.show()

